

Question: PART 4 : LEAN OPERATIONS Part 4 is the continuation of Part 3 . Part 3 is mainly about how the restaurant operates given the
PART : LEAN OPERATIONS
Part is the continuation of Part Part is mainly about how the restaurant operates given
the current settings. Part goes further to identify wastes and eliminate them, which is the
notion of lean operations. To enrich your work, you would need to review and apply the
concepts of lean operations in Module and methods of process improvements in Module
In your report of this part, you need to present the following:
a Explicitly state the wastes that you see in the Uprofile in Part State if the process is
balanced or not. Briefly discuss the effects of the wastes on production, revenue, and profit.
b A brief proposal on how to eliminate the wastes that you find. Hint: labor reconfiguration
c A new Extended Table to show how your proposal in b can work. Essentially, you would do
some experiments trials and errors with the new Extended Table in Excel where:
The total number of employees stays unchanged throughout your experiment.
Assume that you already crosstrained the workers and, hence, you can easily move them
around the resources.
The number of workers at one resource can be understood as the percentages of time they
work at that resource or station for example: two workers work full time or and the third
worker spends only of hisher time at that station Thus, the number of workers can be
presented as a decimal number for example: workers
You can move the workers around the resources with increments as fine as workers.
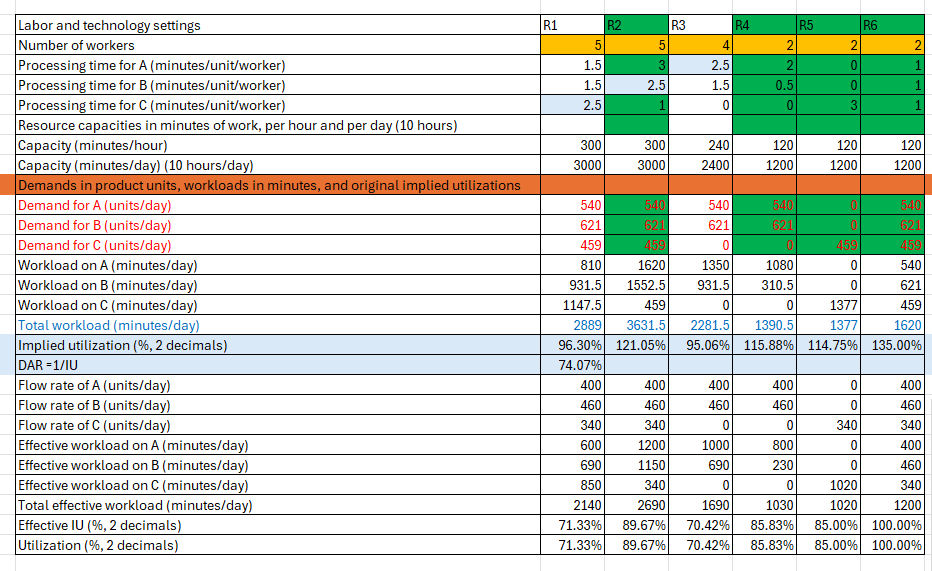
With a new labor setup, you should achieve all utilizationPart Confused on how to calculate the new processing times to balance the IU profile. Please help
tableLabor and technology settings,RRRsqrtRbar Rbar RNumber of workers,Processing time for A minutesunitworkerProcessing time for B minutesunitworkerProcessing time for C minutesunitworkerResource capacities in minutes of work, per hour and per day hoursCapacity minuteshourCapacity minutesday hoursdayDemands in product units, workloads in minutes, and original implied utilizationsDemand for A unitsdayDemand for B unitsdayDemand for C unitsdayWorkload on A minutesdayWorkload on B minutesdayWorkload on C minutesdayTotal workload minutesdaytableImplied utilization decimalstabletableDAR IUFlow rate of A unitsdayFlow rate of B unitsdayFlow rate of C unitsdayEffective workload on A minutesdayEffective workload on B minutesdayEffective workload on C minutesdayTotal effective workload minutesdayEffective IU decimalsUtilization decimals
is the continuation of Part Part is mainly about how the restaurant operates given
the current settings. Part goes further to identify wastes and eliminate them, which is the
notion of lean operations. To enrich your work, you would need to review and apply the
concepts of lean operations in Module and methods of process improvements in Module
In your report of this part, you need to present the following:
a Explicitly state the wastes that you see in the Uprofile in Part State if the process is
balanced or not. Briefly discuss the effects of the wastes on production, revenue, and profit.
b A brief proposal on how to eliminate the wastes that you find. Hint: labor reconfiguration
c A new Extended Table to show how your proposal in b can work. Essentially, you would do
some experiments trials and errors with the new Extended Table in Excel where:
The total number of employees stays unchanged throughout your experiment.
Assume that you already crosstrained the workers and, hence, you can easily move them
around the resources.
The number of workers at one resource can be understood as the percentages of time they
work at that resource or station for example: two workers work full time or and the third
worker spends only of hisher time at that station Thus, the number of workers can be
presented as a decimal number for example: workers
You can move the workers around the resources with increments as fine as workers.
With a new labor setup, you should achieve all utilizations close to eg more than
Step by Step Solution
There are 3 Steps involved in it
1 Expert Approved Answer
Step: 1 Unlock

Question Has Been Solved by an Expert!
Get step-by-step solutions from verified subject matter experts
Step: 2 Unlock
Step: 3 Unlock