

Question: Part 4: Learning Curve with Bootstrapping (8 Points) In this HW we are trying to find the best linear model to predict if a record
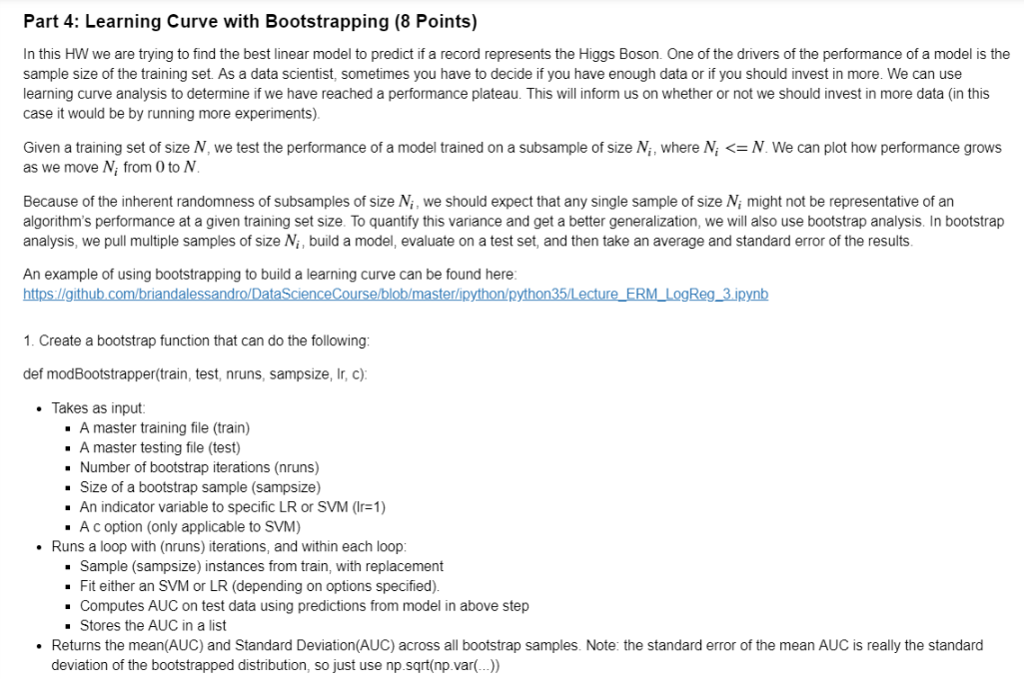
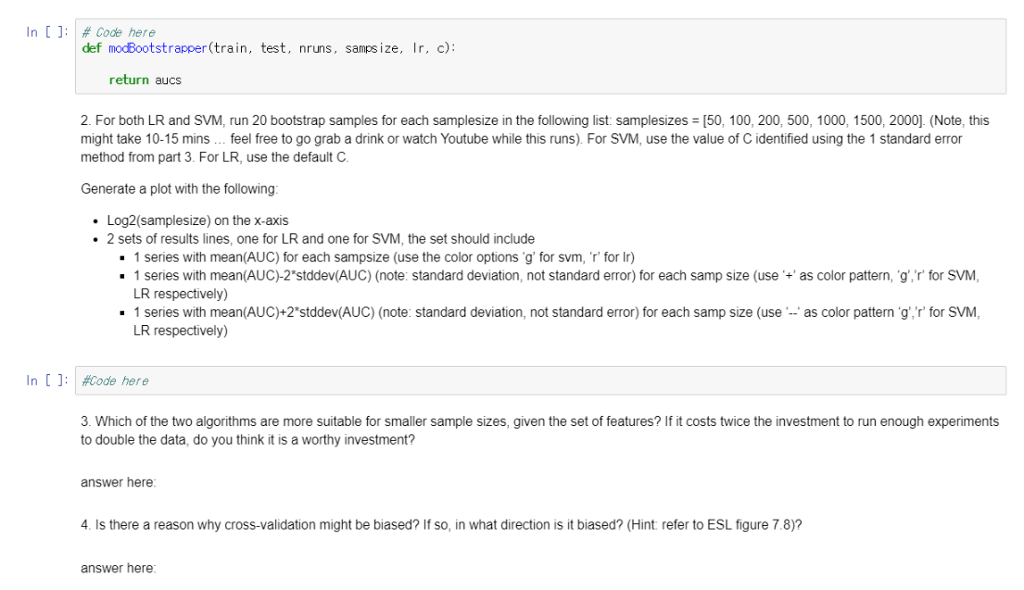
Part 4: Learning Curve with Bootstrapping (8 Points) In this HW we are trying to find the best linear model to predict if a record represents the Higgs Boson. One of the drivers of the performance of a model is the sample size of the training set. As a data scientist, sometimes you have to decide if you have enough data or if you should invest in more. We can use learning curve analysis to determine if we have reached a performance plateau. This will inform us on whether or not we should invest in more data (in this case it would be by running more experiments) Given a training set of size N, we test the performance of a model trained on a subsample of size N, where NN. We can plot how performance grows as we move N; from 0 to N Because of the inherent randomness of subsamples of size Ni, we should expect that any single sample of size Ni might not be representative of an algorithm's performance at a given training set size. To quantify this variance and get a better generalization, we will also use bootstrap analysis. In bootstrap analysis, we pull multiple samples of size N, build a model, evaluate on a test set, and then take an average and standard error of the results. An example of using bootstrapping to build a learning curve can be found here https://g Rynb 1. Create a bootstrap function that can do the following def modBootstrapper(train, test, nruns, sampsize, Ir, c) Takes as input: . A master training file (train) A master testing file (test) Number of bootstrap iterations (nruns) . Size of a bootstrap sample (sampsize) An indicator variable to specific LR or SVM (r-1) A c option (only applicable to SVM) .Runs a loop with (nruns) iterations, and within each loop . Sample (sampsize) instances from train, with replacement Fit either an SVM or LR (depending on options specified). Computes AUC on test data using predictions from model in above step Stores the AUC in a list Returns the mean(AUC) and Standard Deviation(AUC) across all bootstrap samples. Note: the standard error of the mean AUC is really the standard deviation of the bootstrapped distribution, so just use np.sqrt(np.var(...) Part 4: Learning Curve with Bootstrapping (8 Points) In this HW we are trying to find the best linear model to predict if a record represents the Higgs Boson. One of the drivers of the performance of a model is the sample size of the training set. As a data scientist, sometimes you have to decide if you have enough data or if you should invest in more. We can use learning curve analysis to determine if we have reached a performance plateau. This will inform us on whether or not we should invest in more data (in this case it would be by running more experiments) Given a training set of size N, we test the performance of a model trained on a subsample of size N, where NN. We can plot how performance grows as we move N; from 0 to N Because of the inherent randomness of subsamples of size Ni, we should expect that any single sample of size Ni might not be representative of an algorithm's performance at a given training set size. To quantify this variance and get a better generalization, we will also use bootstrap analysis. In bootstrap analysis, we pull multiple samples of size N, build a model, evaluate on a test set, and then take an average and standard error of the results. An example of using bootstrapping to build a learning curve can be found here https://g Rynb 1. Create a bootstrap function that can do the following def modBootstrapper(train, test, nruns, sampsize, Ir, c) Takes as input: . A master training file (train) A master testing file (test) Number of bootstrap iterations (nruns) . Size of a bootstrap sample (sampsize) An indicator variable to specific LR or SVM (r-1) A c option (only applicable to SVM) .Runs a loop with (nruns) iterations, and within each loop . Sample (sampsize) instances from train, with replacement Fit either an SVM or LR (depending on options specified). Computes AUC on test data using predictions from model in above step Stores the AUC in a list Returns the mean(AUC) and Standard Deviation(AUC) across all bootstrap samples. Note: the standard error of the mean AUC is really the standard deviation of the bootstrapped distribution, so just use np.sqrt(np.var(...)
Step by Step Solution
There are 3 Steps involved in it

Get step-by-step solutions from verified subject matter experts