

Question: Problem set 4: use the following information to answer questions 11-15 (15 points total): Let's examine the relationship between GNP per capita and the percentage
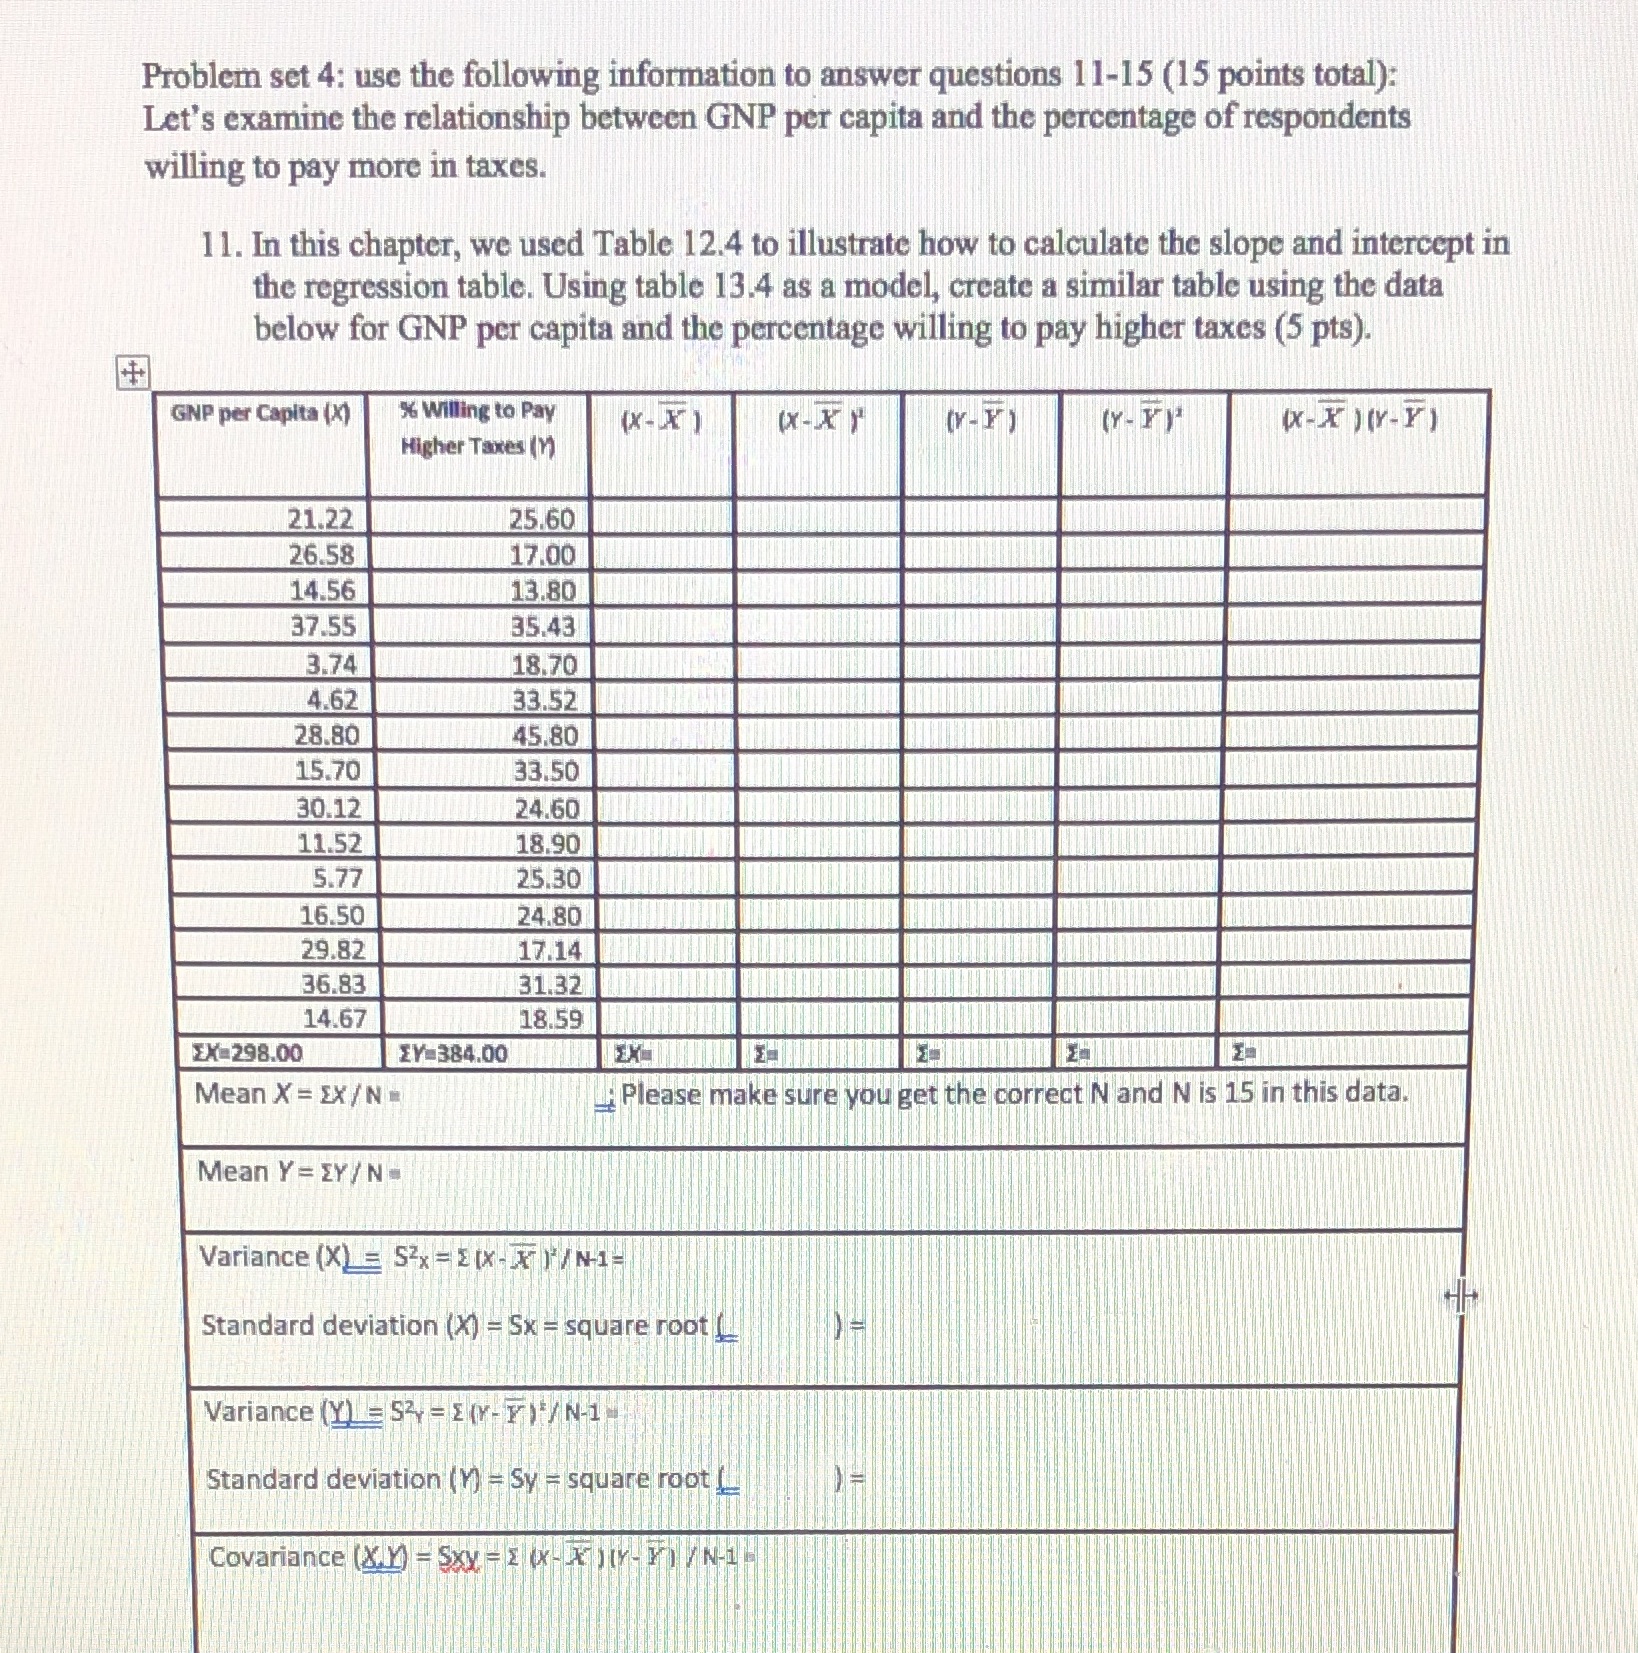
Problem set 4: use the following information to answer questions 11-15 (15 points total): Let's examine the relationship between GNP per capita and the percentage of respondents willing to pay more in taxes. 1 1. In this chapter, we used Table 12.4 to illustrate how to calculate the slope and intercept in the regression table. Using table 13.4 as a model, create a similar table using the data below for GNP per capita and the percentage willing to pay higher taxes (5 pts). GNP per Capita (X) Willing to Pay (X - X ) Higher Taxes ()) (X - X ) (Y- F) ( X - X ) ( Y - Y ) 21.22 25.60 26.58 17.00 14.56 13.80 37.55 35.43 3.74 18.70 4.62 33.52 28.80 45.80 15.70 33.50 30.12 24.60 11.52 18.90 5.77 25.30 16.50 24.80 29.82 17.14 36.83 31.32 14.67 18.59 EX- 298.00 ZY 384.00 Mean X = EX/ N = Please make sure you get the correct N and N is 15 in this data. Mean Y = EY/ N- Variance (X) = S x = =(x-X) /N1- Standard deviation (X) = Sx = square root Variance (Y) = S21 = E (Y- F) /N-1= Standard deviation (Y) = Sy = square root ( Covariance (X.Y) - Sxx - 1 ( X ) I - F /
Step by Step Solution
There are 3 Steps involved in it

Get step-by-step solutions from verified subject matter experts