

Question: Part A. Break-even Analysis Part B. Budgets Utility Total Month Case Productic Cost Finished Goods Inventory January 500 $ 600.00 February 800 660.00 Cases Cost
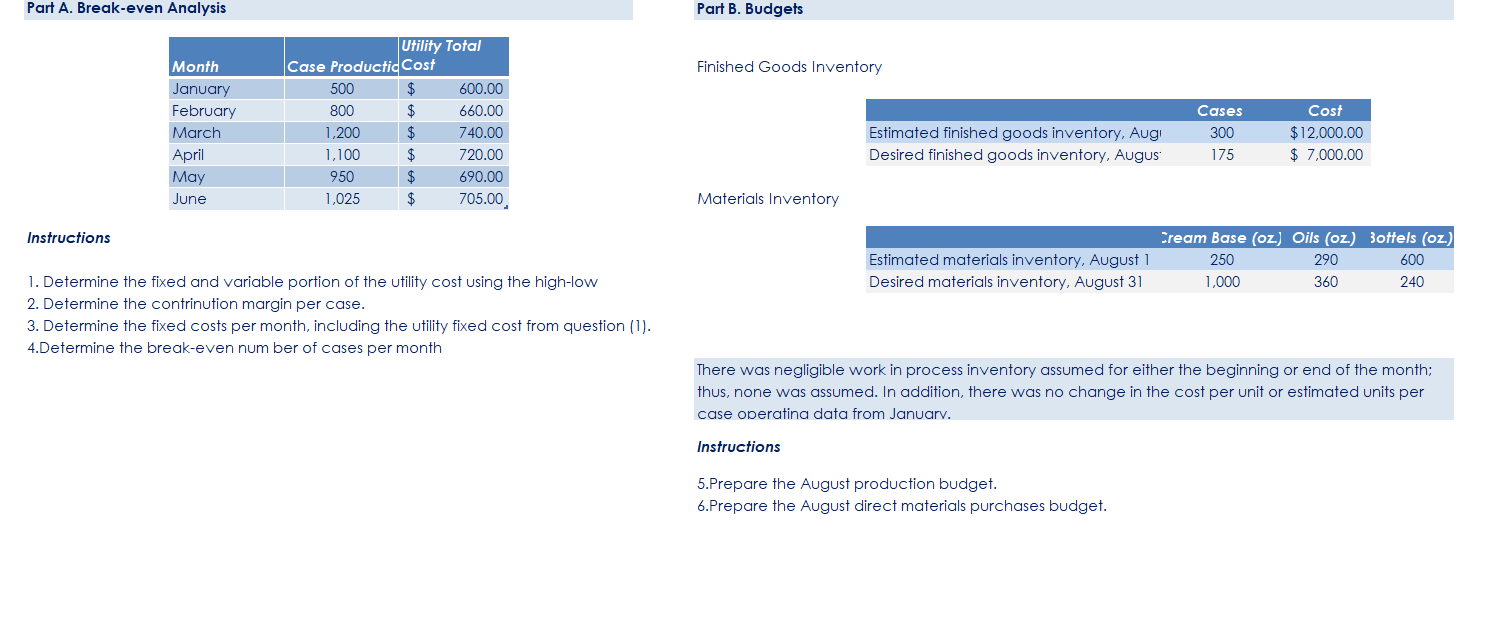
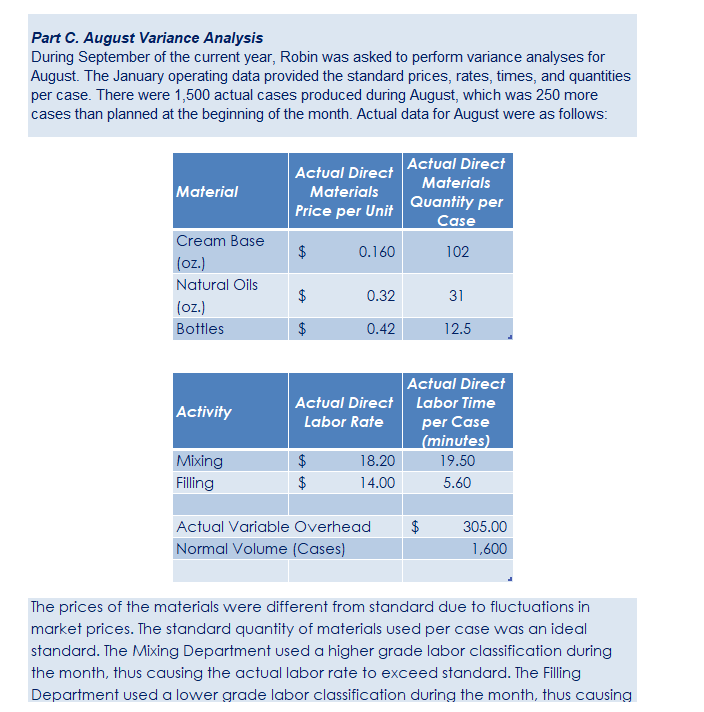
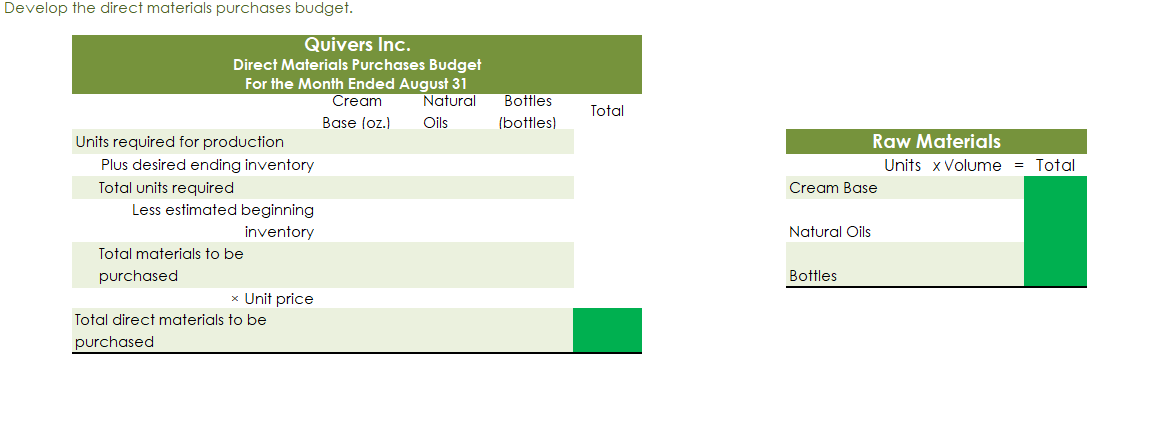
Part A. Break-even Analysis Part B. Budgets Utility Total Month Case Productic Cost Finished Goods Inventory January 500 $ 600.00 February 800 660.00 Cases Cost March 1,200 740.00 Estimated finished goods inventory, Aug 300 $ 12,000.00 April 1,100 720.00 Desired finished goods inventory, August 175 $ 7,000.00 May 950 $ 690.00 June 1,025 705.00 Materials Inventory Instructions Cream Base (oz.) Oils (oz.) Bottels (oz.) Estimated materials inventory, August 1 250 290 500 1. Determine the fixed and variable portion of the utility cost using the high-low Desired materials inventory, August 31 1,000 360 240 2. Determine the contrinution margin per case. 3. Determine the fixed costs per month, including the utility fixed cost from question (1). 4.Determine the break-even num ber of cases per month There was negligible work in process inventory assumed for either the beginning or end of the month; thus, none was assumed. In addition, there was no change in the cost per unit or estimated units per case operatina data from January. Instructions 5.Prepare the August production budget. 6.Prepare the August direct materials purchases budget.Part C. August Variance Analysis During September of the current year, Robin was asked to perform variance analyses for August. The January operating data provided the standard prices, rates, times, and quantities per case. There were 1,500 actual cases produced during August, which was 250 more cases than planned at the beginning of the month. Actual data for August were as follows: Actual Direct Actual Direct Material Materials Materials Price per Unit Quantity per Case Cream Base $ 0.160 102 (oz.) Natural Oils 0.32 31 (oz.) Bottles 0.42 12.5 Actual Direct Activity Actual Direct Labor Time Labor Rate per Case (minutes) Mixing 18.20 19.50 Filling 14.00 5.60 Actual Variable Overhead $ 305.00 Normal Volume (Cases) 1,600 The prices of the materials were different from standard due to fluctuations in market prices. The standard quantity of materials used per case was an ideal standard. The Mixing Department used a higher grade labor classification during the month, thus causing the actual labor rate to exceed standard. The Filling Department used a lower grade labor classification during the month, thus causingDevelop the direct materials purchases budget. Quivers Inc. Direct Materials Purchases Budget For the Month Ended August 31 Cream Natural Bottles Total Base (oz.) Oils (bottles) Units required for production Raw Materials Plus desired ending inventory Units x Volume = Total Total units required Cream Base Less estimated beginning inventory Natural Oils Total materials to be purchased Bottles * Unit price Total direct materials to be purchased
Step by Step Solution
There are 3 Steps involved in it

Get step-by-step solutions from verified subject matter experts