

Question: PART A: CASE STUDY Read the case below. Answer the following TWO (2) questions. A construction manager for company Andaman has been engaged to develop
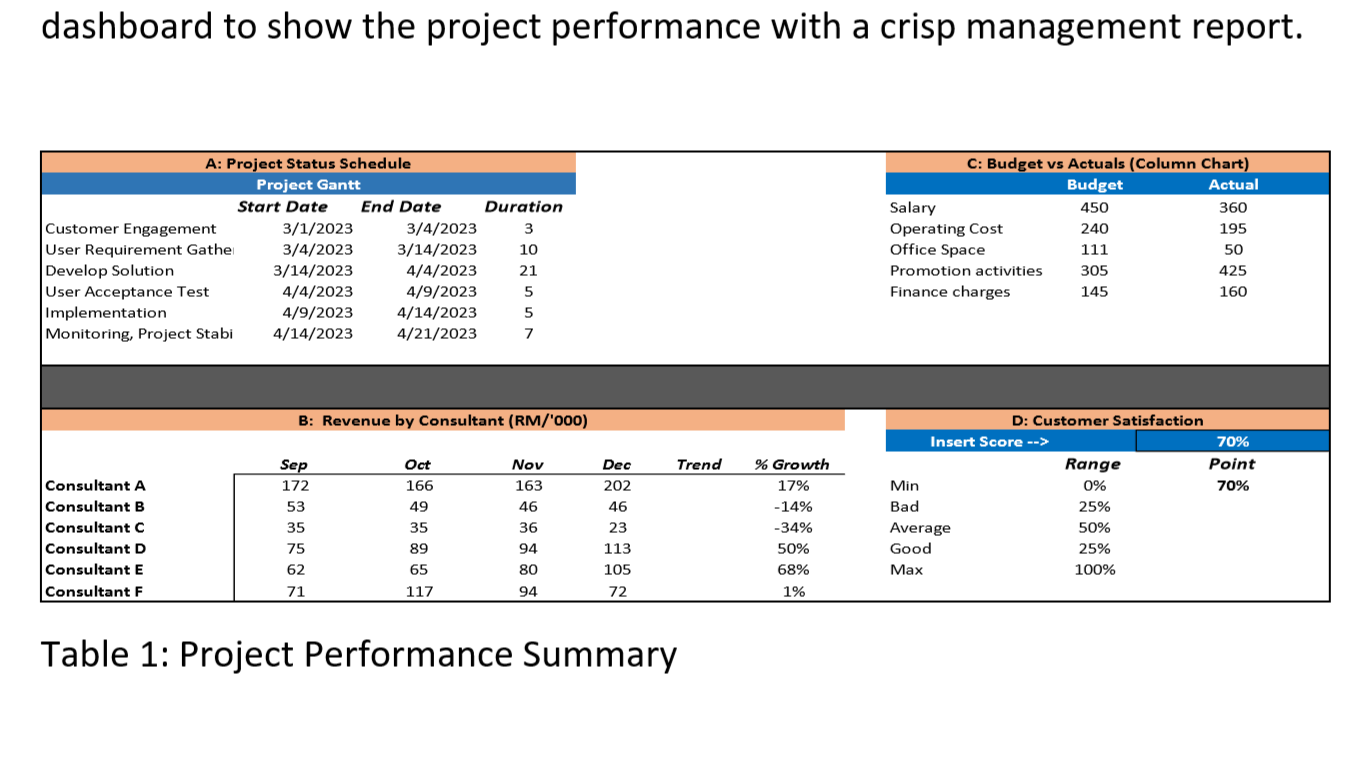
PART A: CASE STUDY Read the case below. Answer the following TWO (2) questions. A construction manager for company Andaman has been engaged to develop a customized customer solutions. The construction manager intends to develop data analytics to present his project performance. He wanted to indicate the project gantt, the estimated revenue by consultants, the budget expenditure variance and customer satisfaction. He has painstaking summarize the performance as indicated in Table 1 (data is available on the reference below). Based on the information (from Table 1) he intends to develop a performance dashboard to show the project performance with a crisp management report
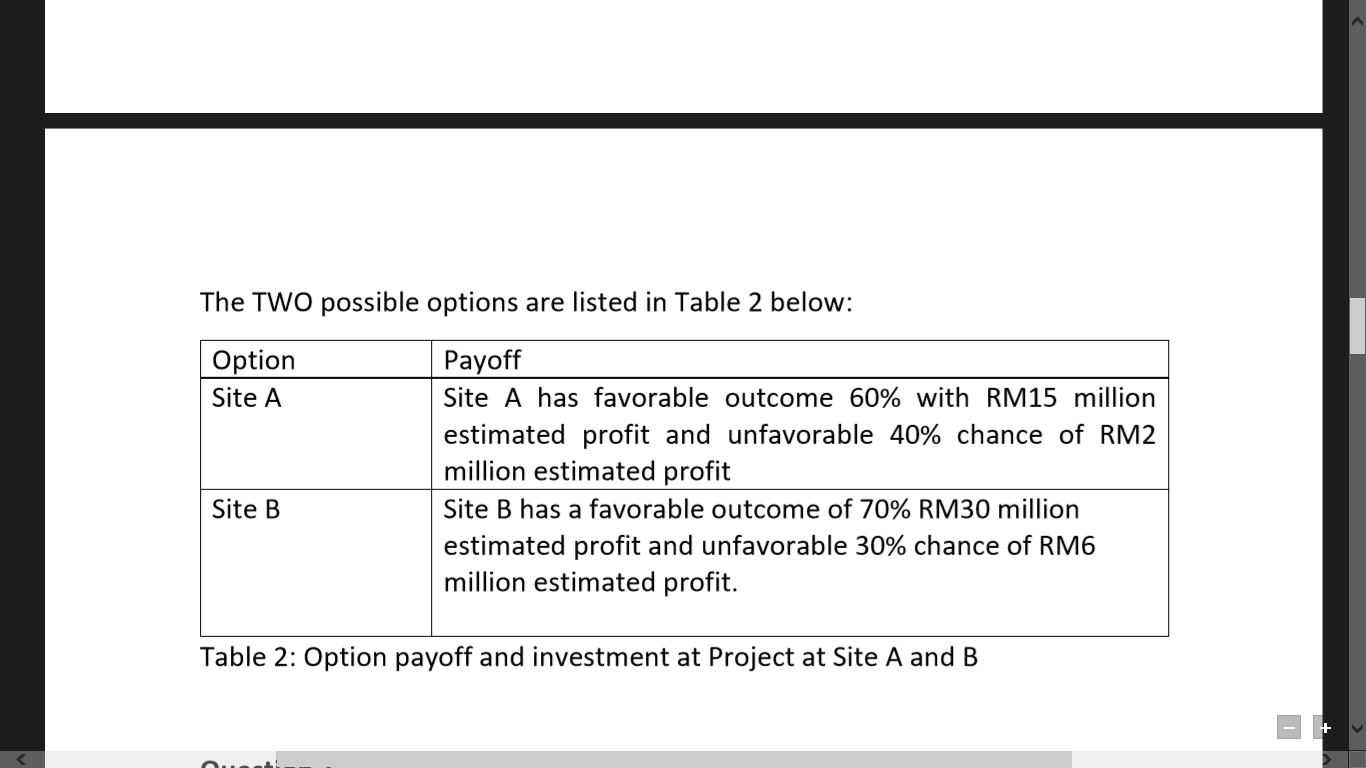
In addition, there is a new opportunity arise for the second half of the year. There is opportunity Andaman Sdn Bhd. to expand business to construct a new warehouse for an existing e-commerce company. The are two options. The first option is expand at site A and the other option is to expand at site B. Both site A and B offer different payoff with different level of investment. The company can either expand at site A (RM6 million construction cost) OR site B (RM10 million construction cost). The project manager wanted to evaluate the options for a project (new warehouse) expansion objectively based on the expected monetary value (EMV).
Question 1 a) From the project summarized data (Table 1), the project manager commissioned you to develop a dashboard that shows the project performance below using appropriate graph or visuals. i) Project Gantt ii) Budgeting variance iii) Estimated Revenue iv) Customer Satisfaction b) From the dashboard, analysed and write a project summary report. (Hint: You may used bar charts, pie/circle chart, stacked graph, trend line into a consolidated project dashboard)
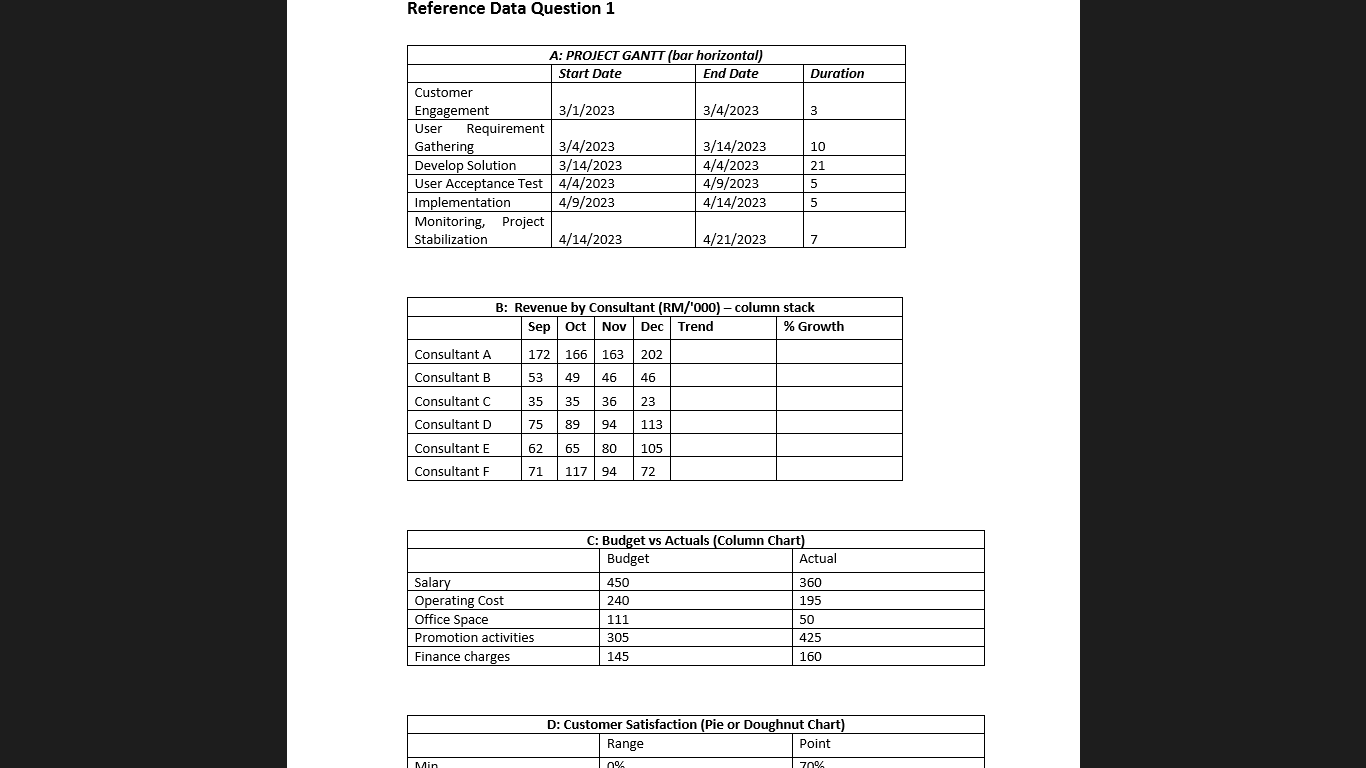
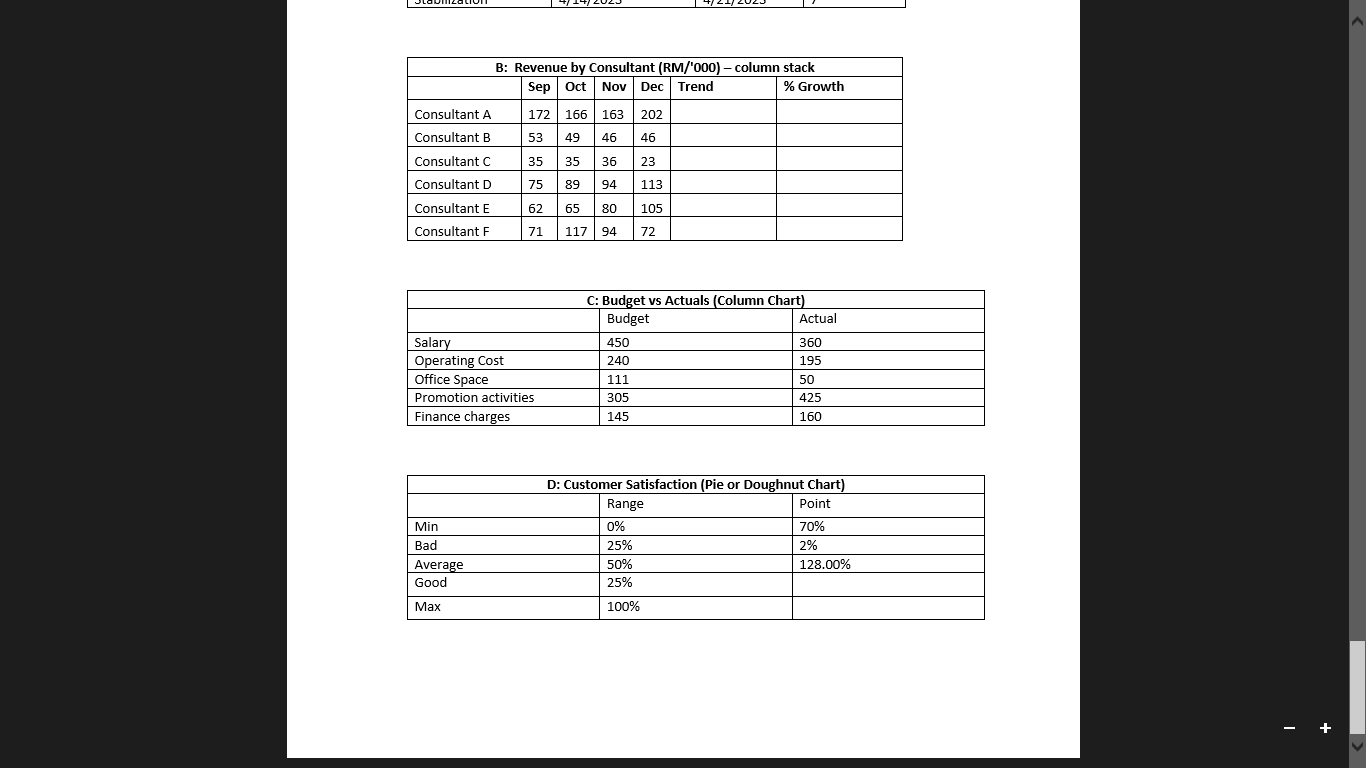
dashboard to show the project performance with a crisp management report. Table 1: Project Performance Summary The TWO possible options are listed in Table 2 below: Table 2: Option payoff and investment at Project at Site A and B Reference Data Question 1
Step by Step Solution
There are 3 Steps involved in it

Get step-by-step solutions from verified subject matter experts