

Question: PART A) Create a flowchart for a MATLAB script that calls UDF projectile to calculate and create a matrix named MaxHeight with the values given
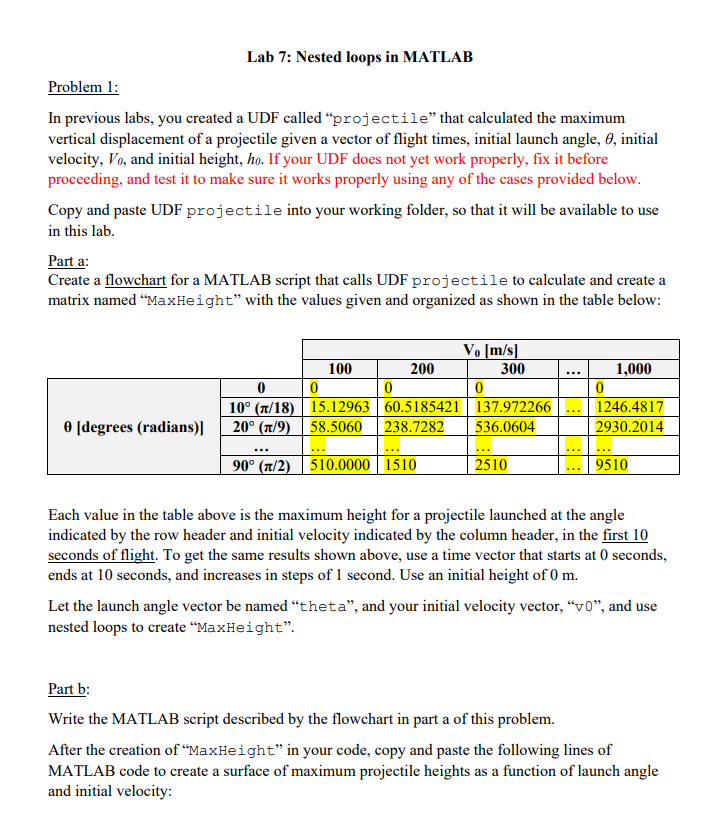
PART A) Create a flowchart for a MATLAB script that calls UDF projectile to calculate and create a matrix named MaxHeight with the values given and organized as shown in the table below:
The "projectile" UDF that it refrences is as follows:
function [x,y,maxy,max_x,maxt] = projectile(Vo, theta, H, t) % start UDF (t = time, H=initial height, Vo = initial velocity, theta = initial angle)
g = 9.8; x = (t)*(Vo)*cos(theta); % horizontal distance traveled per given time in seconds y = (H)+(t)*(Vo)*sin(theta)-(0.5)*(g)*(t.^2); % vertical distance traveled per given time in seconds [maxy,index] = max(y); % max vertical distance in meters max_x = x(index); % max horizontal distnace in meters where maxy is greatest maxt = t(index); % the max time in seconds where maxy and max_x are greatest end % End UDF
Step by Step Solution
There are 3 Steps involved in it

Get step-by-step solutions from verified subject matter experts