

Question: Part ( a ) Develop a seasonally adjusted forecast model in excel for seat occupancy. Forecast seat occupancy for year 6 by using a linear
Part a Develop a seasonally adjusted forecast model in excel for seat occupancy. Forecast seat occupancy for year by using a linear trend line forecast estimate for seat occupancy in year
Part b Develop linear regression models in excel relating seat occupancy to discount fares in order to forecast seat occupancy for EACH QUARTER separately in year Assume a fare discount of for quarter for quarter for quarter and for quarter
Part c Compare the forecasts developed in a and b and indicate which one appears to be the best. Just an intuitive assessment would be enough.
Part d Develop an adjusted exponential smoothing forecast model alpha and beta for the quarterly data to forecast seat occupancy and compare its accuracy with the seasonally adjusted model developed in a using a forecast accuracy measure eg MAD Note that you must use the quarterly data not aggregated annual data and you can only estimate the seat occupancy for the first quarter of year
Bonus pts:Find the optimal value of alpha and beta in part d that minimizes the sum of squared errors.
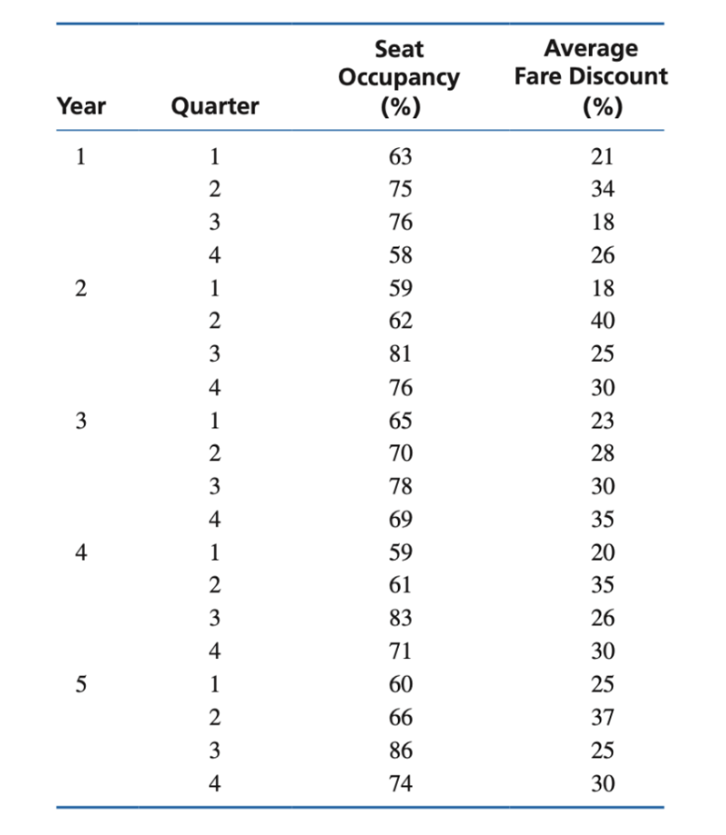
begintabularcccc
hline Year & Quarter &
beginarrayc
text Seat
text Occupancy
text
endarray
& Average Fare Discount
hline multirowt & & &
hline & & &
hline & & &
hline & & &
hline multirowt & & &
hline & & &
hline & & &
hline & & &
hline multirowt & & &
hline & & &
hline & & &
hline & & &
hline multirowt & & &
hline & & &
hline & & &
hline & & &
hline multirowt & & &
hline & & &
hline & & &
hline & & &
hline
endtabular
Step by Step Solution
There are 3 Steps involved in it
1 Expert Approved Answer
Step: 1 Unlock

Question Has Been Solved by an Expert!
Get step-by-step solutions from verified subject matter experts
Step: 2 Unlock
Step: 3 Unlock