

Question: Arrow Air is a regional airline that operates in Eastern Canada. It has collected data for the percentage of available seats occupied on its flights
Arrow Air is a regional airline that operates in Eastern Canada. It has collected data for the percentage of available seats occupied on its flights for four quarters€”(1) January€“March,
(2) April€“June,
(3) July€“September, and
(4) October€“December€”for the past five years. The company also has collected data for the average percentage fare discount for each of these quarters as follows:
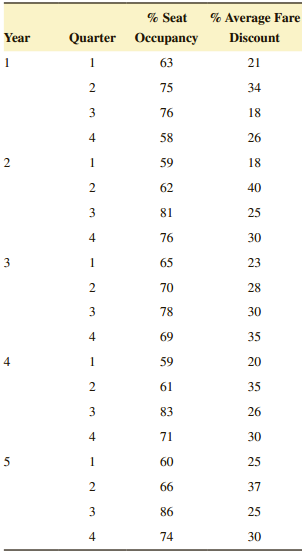
a. Develop a seasonally adjusted forecast model for seat occupancy. Forecast seat occupancy for year 6 (using a linear trend line forecast estimate for seat occupancy in year 6).
b. Develop linear regression models relating seat occupancy to discount fares to forecast seat occupancy for each quarter in year 6. Assume a fare discount of 20% for quarter 1, 36% for quarter 2, 25% for quarter 3, and 30% for quarter 4.
c. Compare the forecasts developed in parts (a) and (b) and indicate which one appears to be the best.
% Average Fare % Seat Year Quarter ancy Discount 63 21 75 34 76 18 58 26 59 18 62 40 81 25 4 76 30 3 65 23 70 28 78 30 69 35 59 20 61 35 83 26 71 30 1 60 25 66 37 86 25 4 74 30
Step by Step Solution
3.48 Rating (161 Votes )
There are 3 Steps involved in it
a Seasonally adjusted forecast Quarter 1 D 1 306 Quarter 2 D 2 334 Qua... View full answer

Get step-by-step solutions from verified subject matter experts