

Question: Part A: Estimate and interpret the correlation coefficient. (5 points) Part B: Create an outlier point for this graph that would cause the correlation to
Part A: Estimate and interpret the correlation coefficient. (5 points)
Part B: Create an outlier point for this graph that would cause the correlation to decrease. Explain your reasoning. (5 points
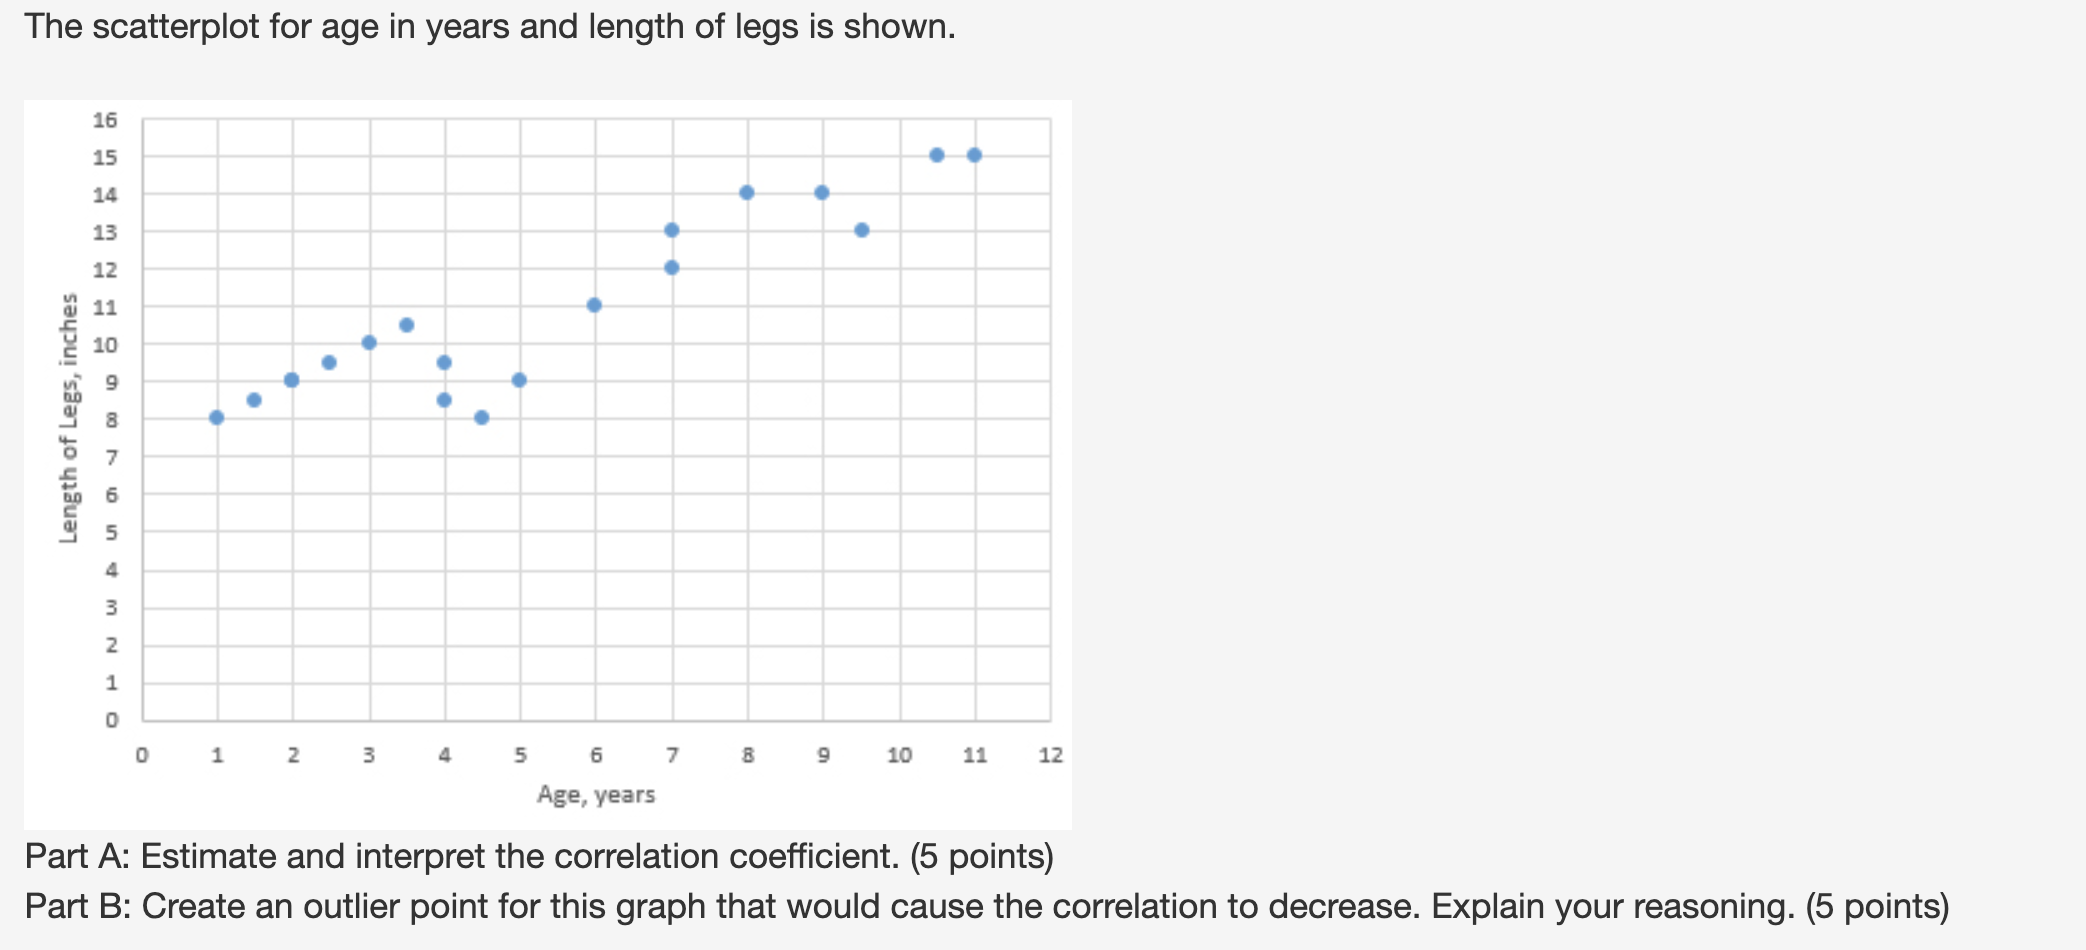
The scatterplot for age in years and length of legs is shown. 5555 o o oo 0 Length of Legs, indies ouNunmowmw Age, years Part A: Estimate and interpret the correlation coefficient. (5 points) Part B: Create an outlier point for this graph that would cause the correlation to decrease. Explain your reasoning. (5 points)
Step by Step Solution
There are 3 Steps involved in it
1 Expert Approved Answer
Step: 1 Unlock

Question Has Been Solved by an Expert!
Get step-by-step solutions from verified subject matter experts
Step: 2 Unlock
Step: 3 Unlock