

Question: Part A - Practice Reading and Comparing Graphs Consider the following graph containing line plots for the moles of Product 1 versus time (minutes) and
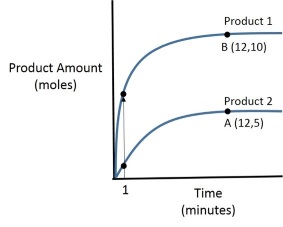
Part A - Practice Reading and Comparing Graphs Consider the following graph containing line plots for the moles of Product 1 versus time (minutes) and the moles of Product 2 versus time in minutes. The plot shows product amount in moles as a function of time in minutes. There are two curves: for product 1 and for product 2. Both curves start at the origin, then they rise, and then go to the plateau. But the curve for product 2 is located below the curve for product 1. There is point A with coordinates 12,5 at the curve for product 2 and point B with coordinates 12,10 at the curve for product 1. Choose all of the key terms/phrases that describe the plots on this graph. Check all that apply. View Available Hint(s) Check all that apply.
Slope has units of minutes per moles.
y-intercept is at (12,10).
negative relationship between moles and minutes
y-intercept is at the origin.
plot of moles versus minutes
Slope is zero.
positive relationship between moles and minutes
Slope has units of moles per minute.
More of Product 1 is obtained in 12 minutes.
can be described using equation y=mx+b
More of Product 2 is obtained in 12 minutes.
plot of minutes versus moles
Product Amount (moles) 1 Product 1 B (12,10) Product 2 A (12,5) Time (minutes)
Step by Step Solution
3.43 Rating (150 Votes )
There are 3 Steps involved in it
To analyze the information given and graph characteristics lets address each statement 1 Slope has u... View full answer

Get step-by-step solutions from verified subject matter experts