

Question: Q PLZ SOLVE AS MUCH AS POSSIBLE!! APPENDIX TABLE LINK : https://www.webassign.net/mendstat15/mendstat15_appendix_tables.pd 12.5 A researcher devised a scale to measure the freshness of roses that
Q
PLZ SOLVE AS MUCH AS POSSIBLE!!
APPENDIX TABLE LINK : https://www.webassign.net/mendstat15/mendstat15_appendix_tables.pd
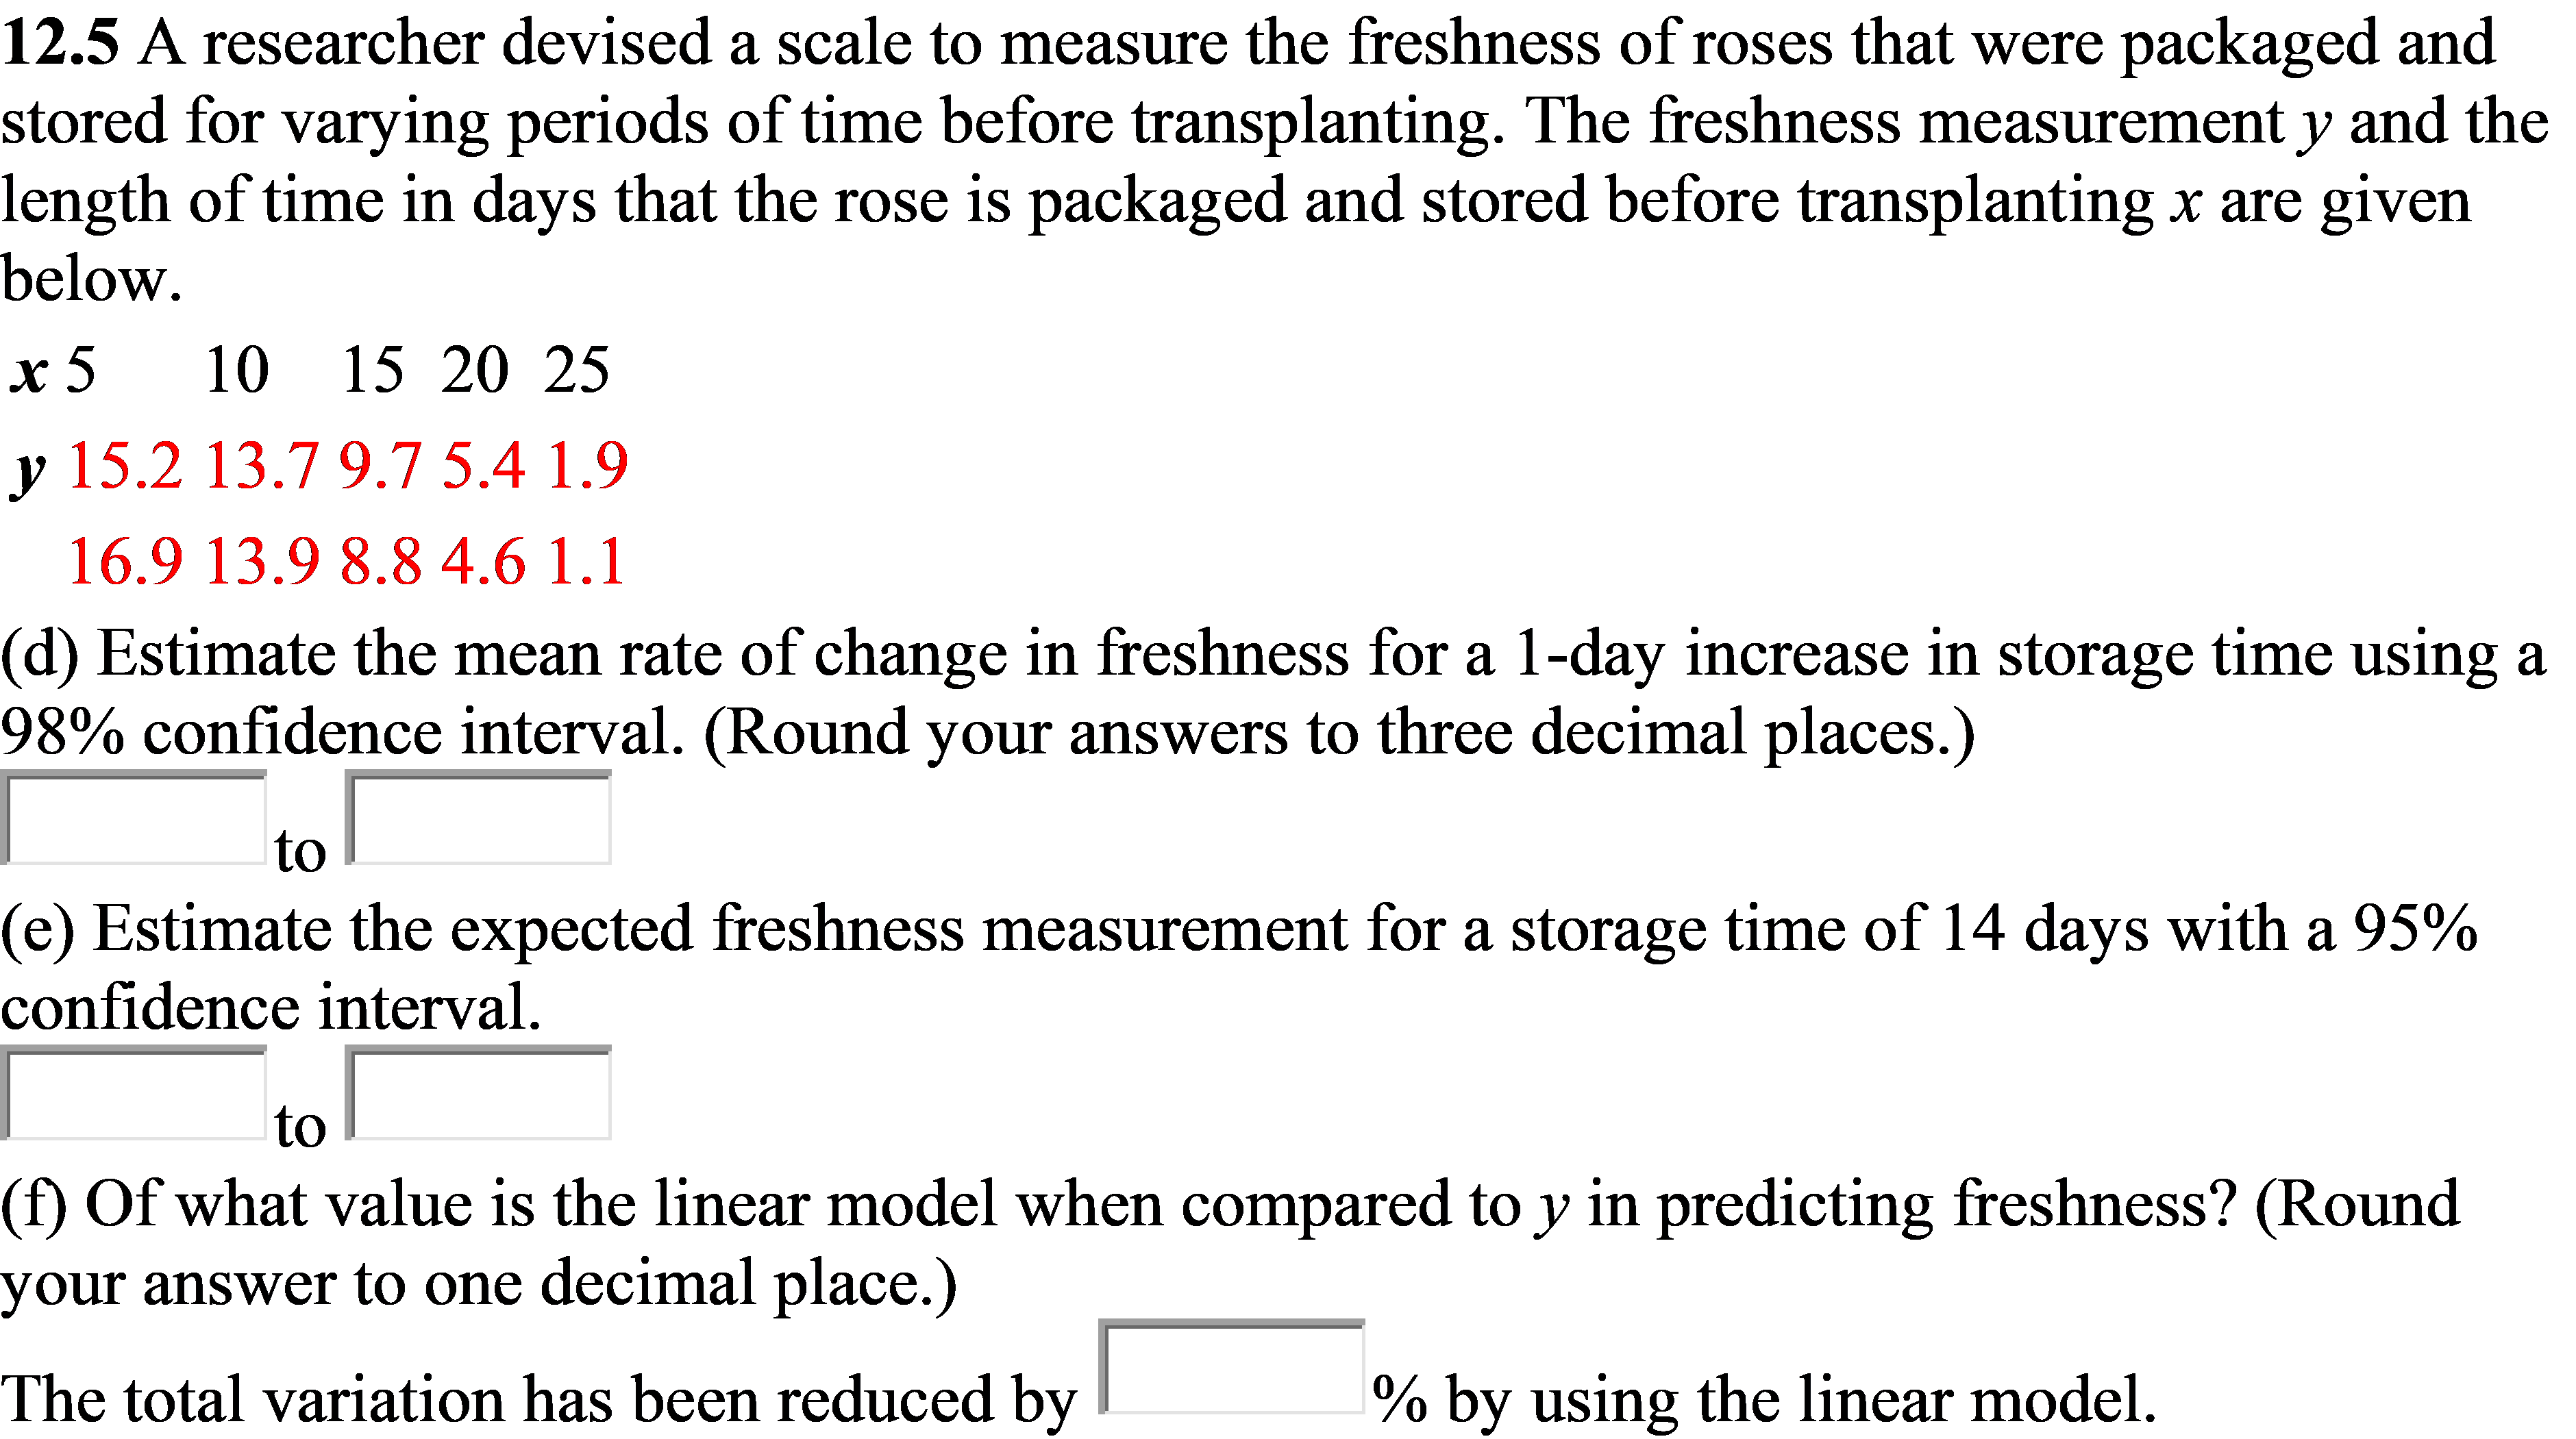
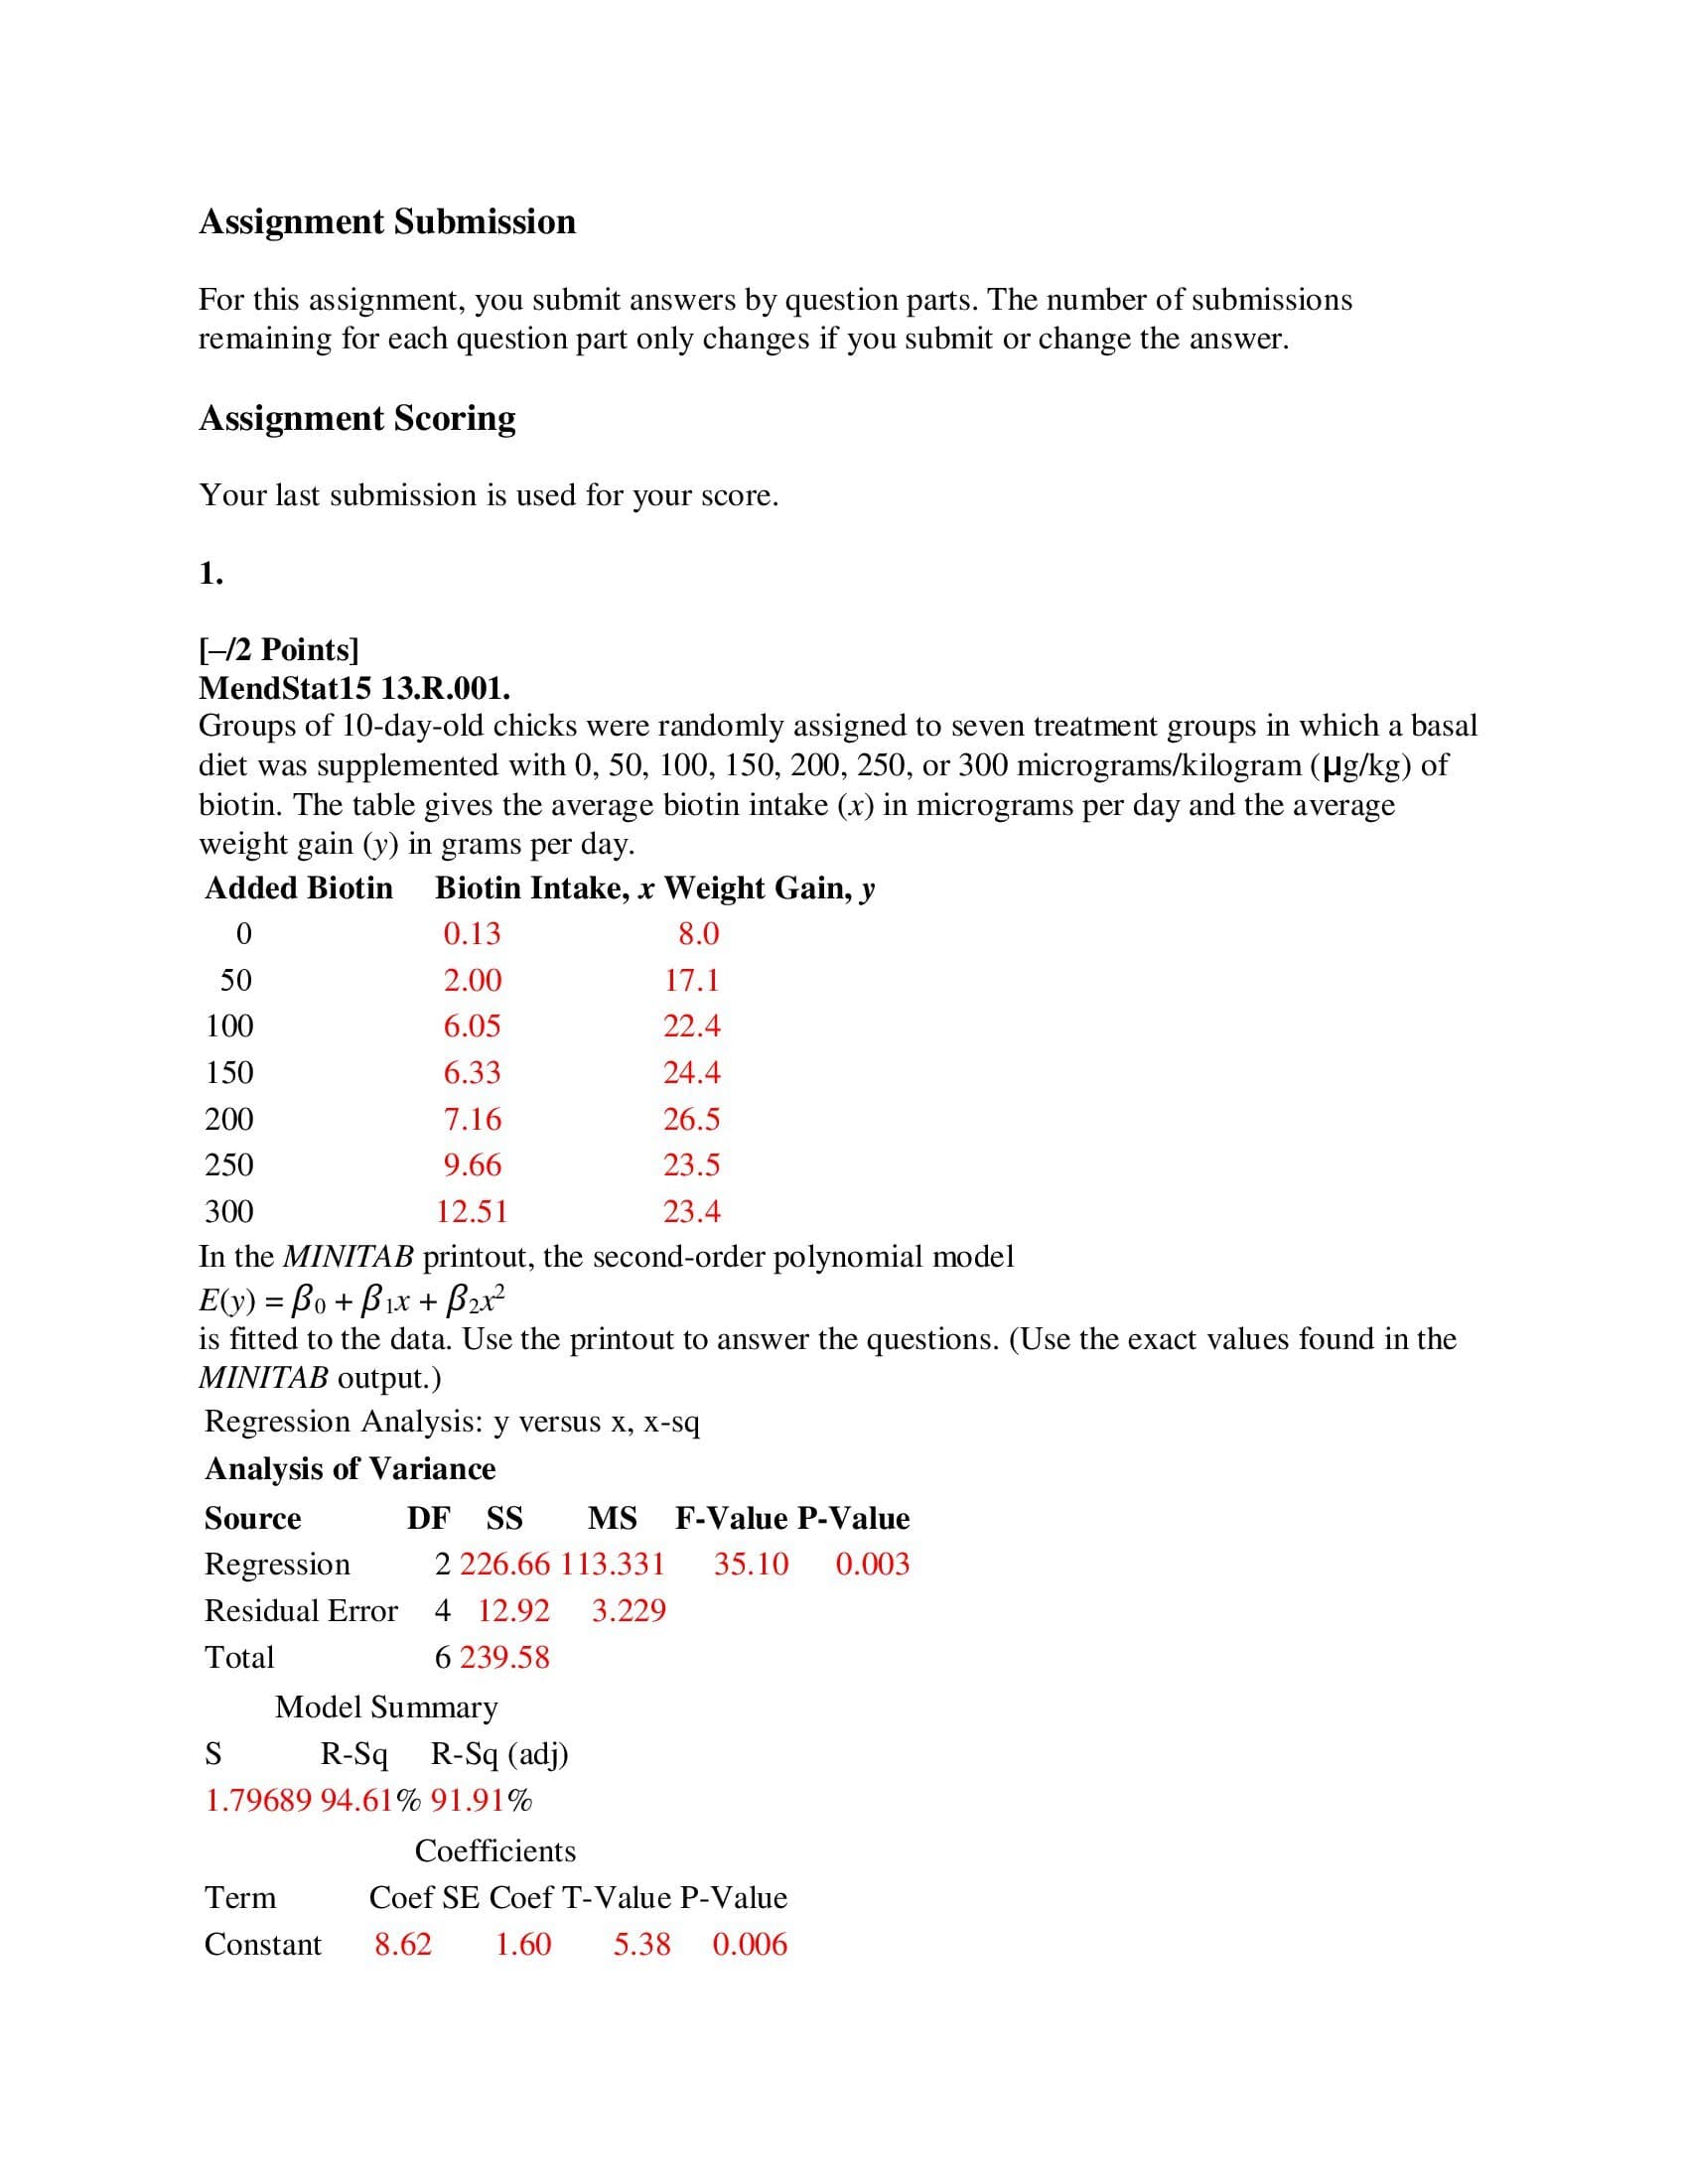
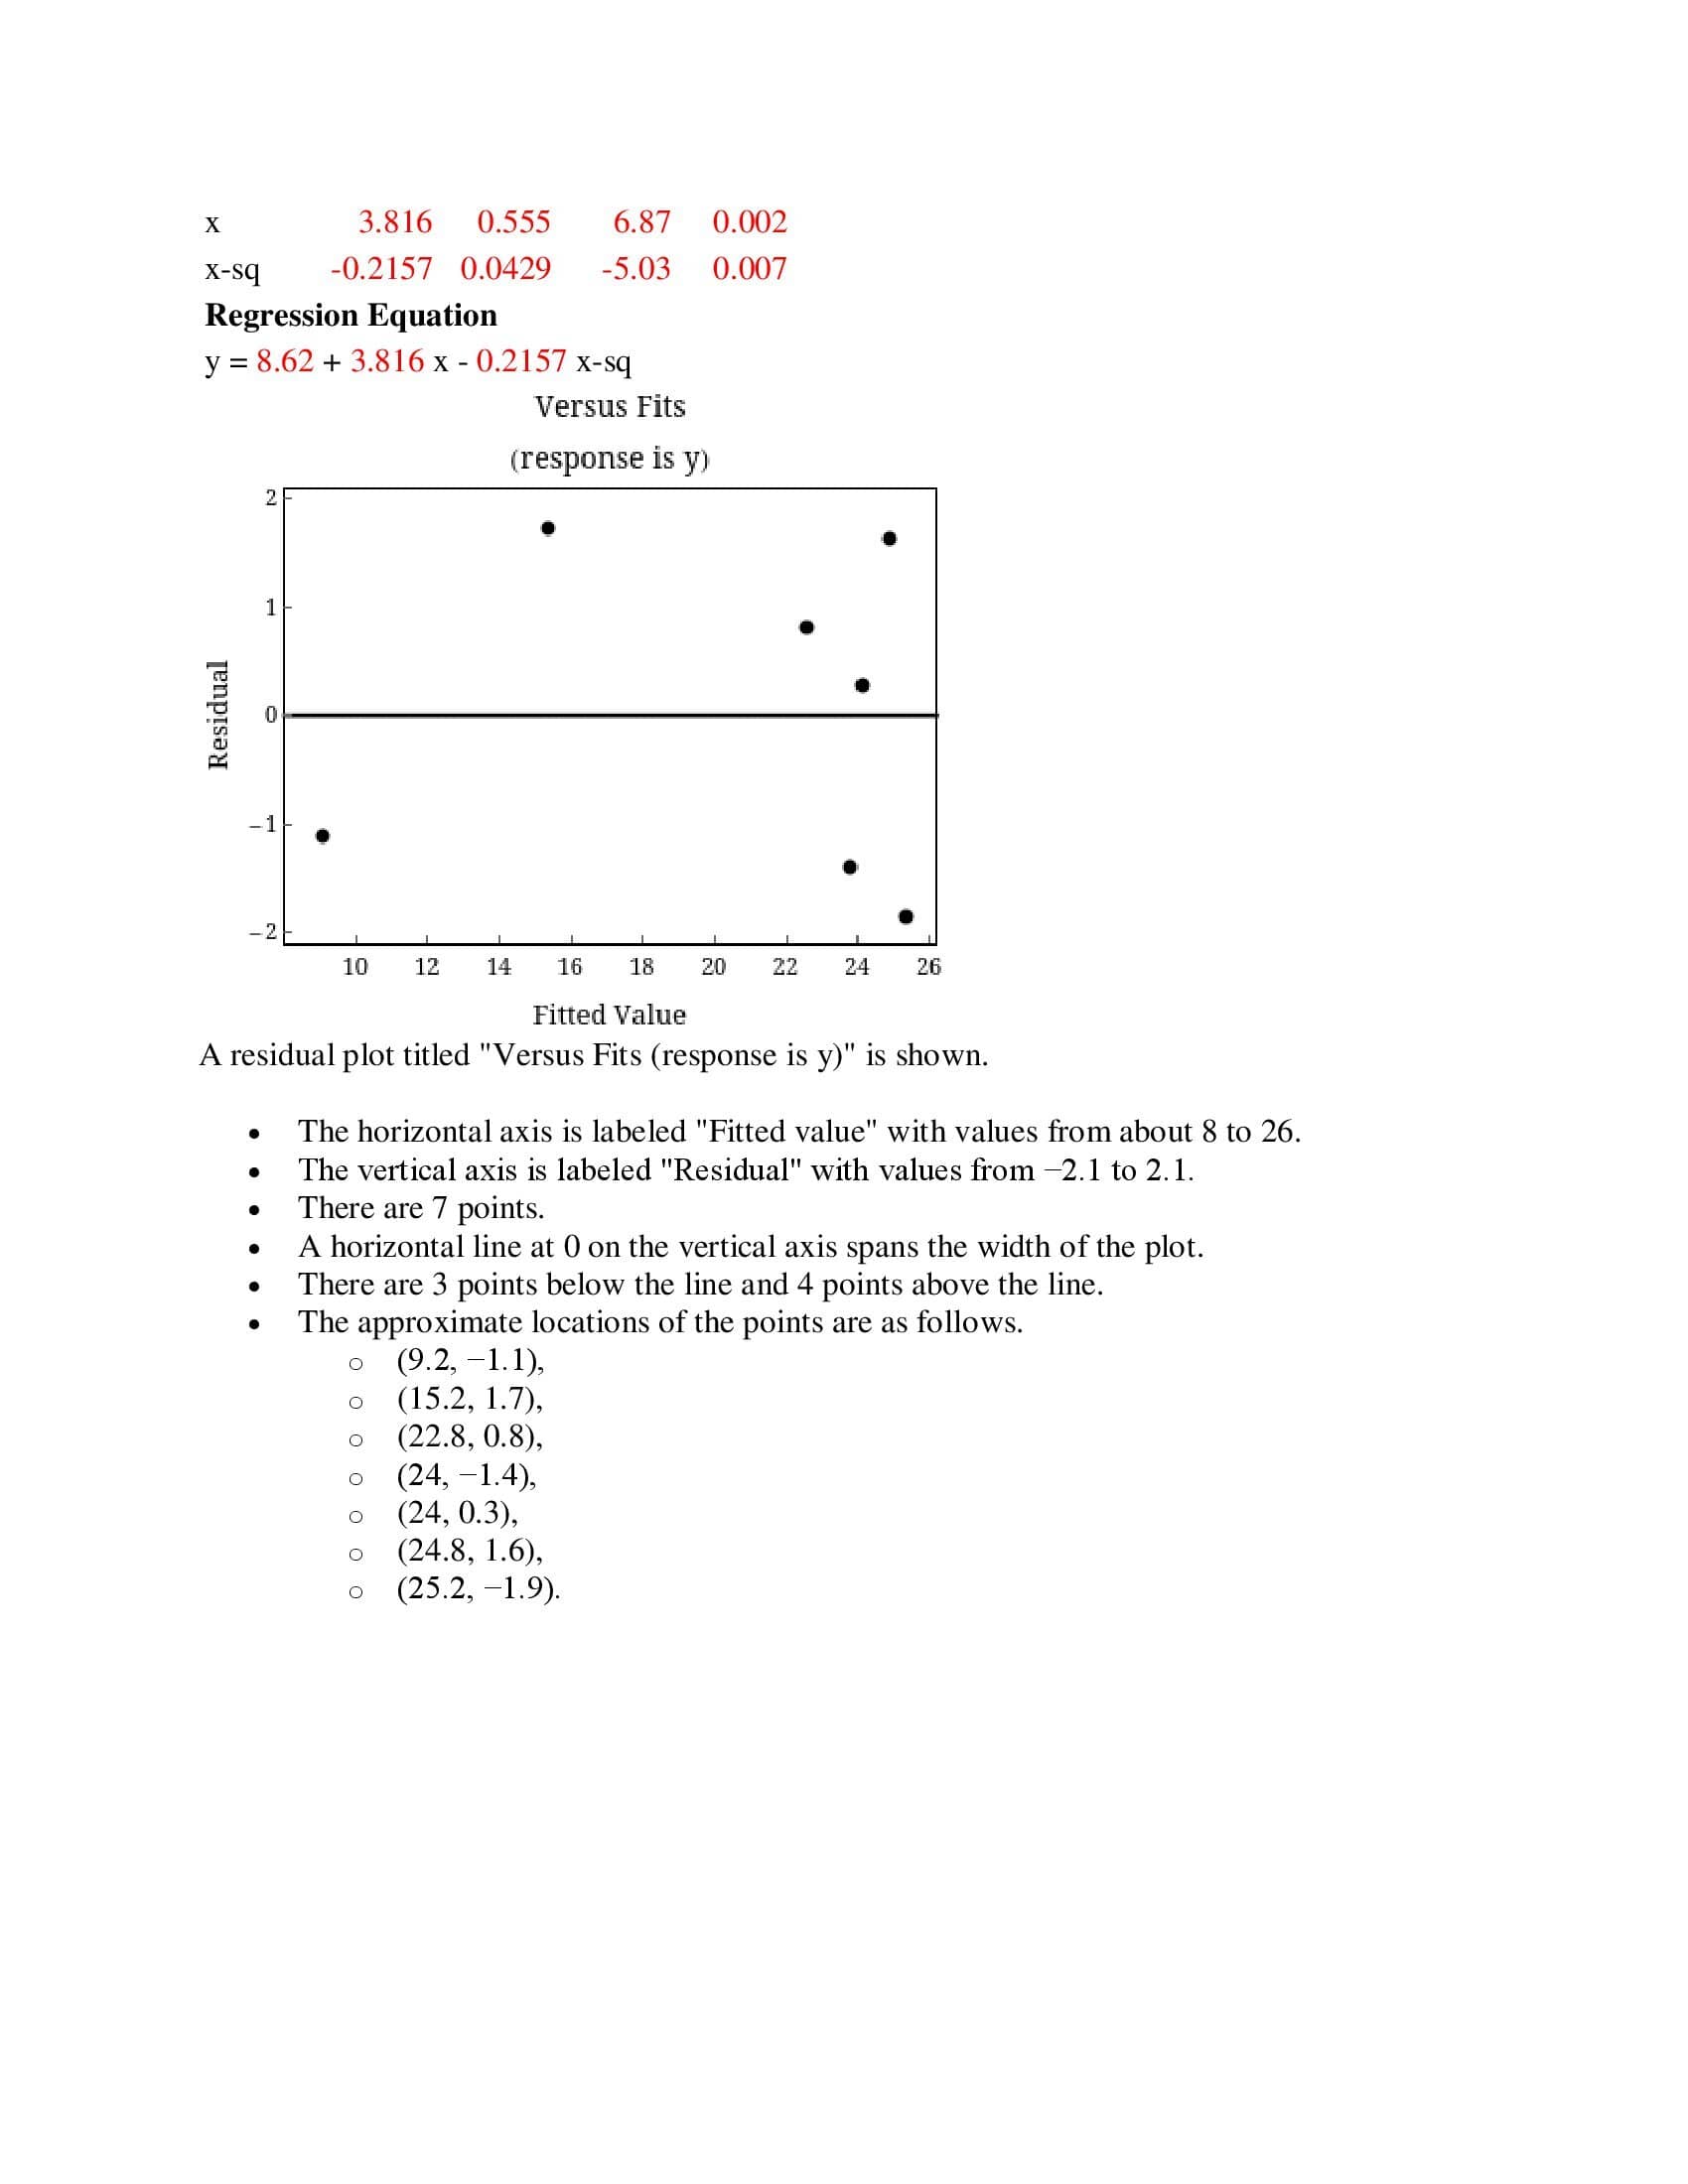
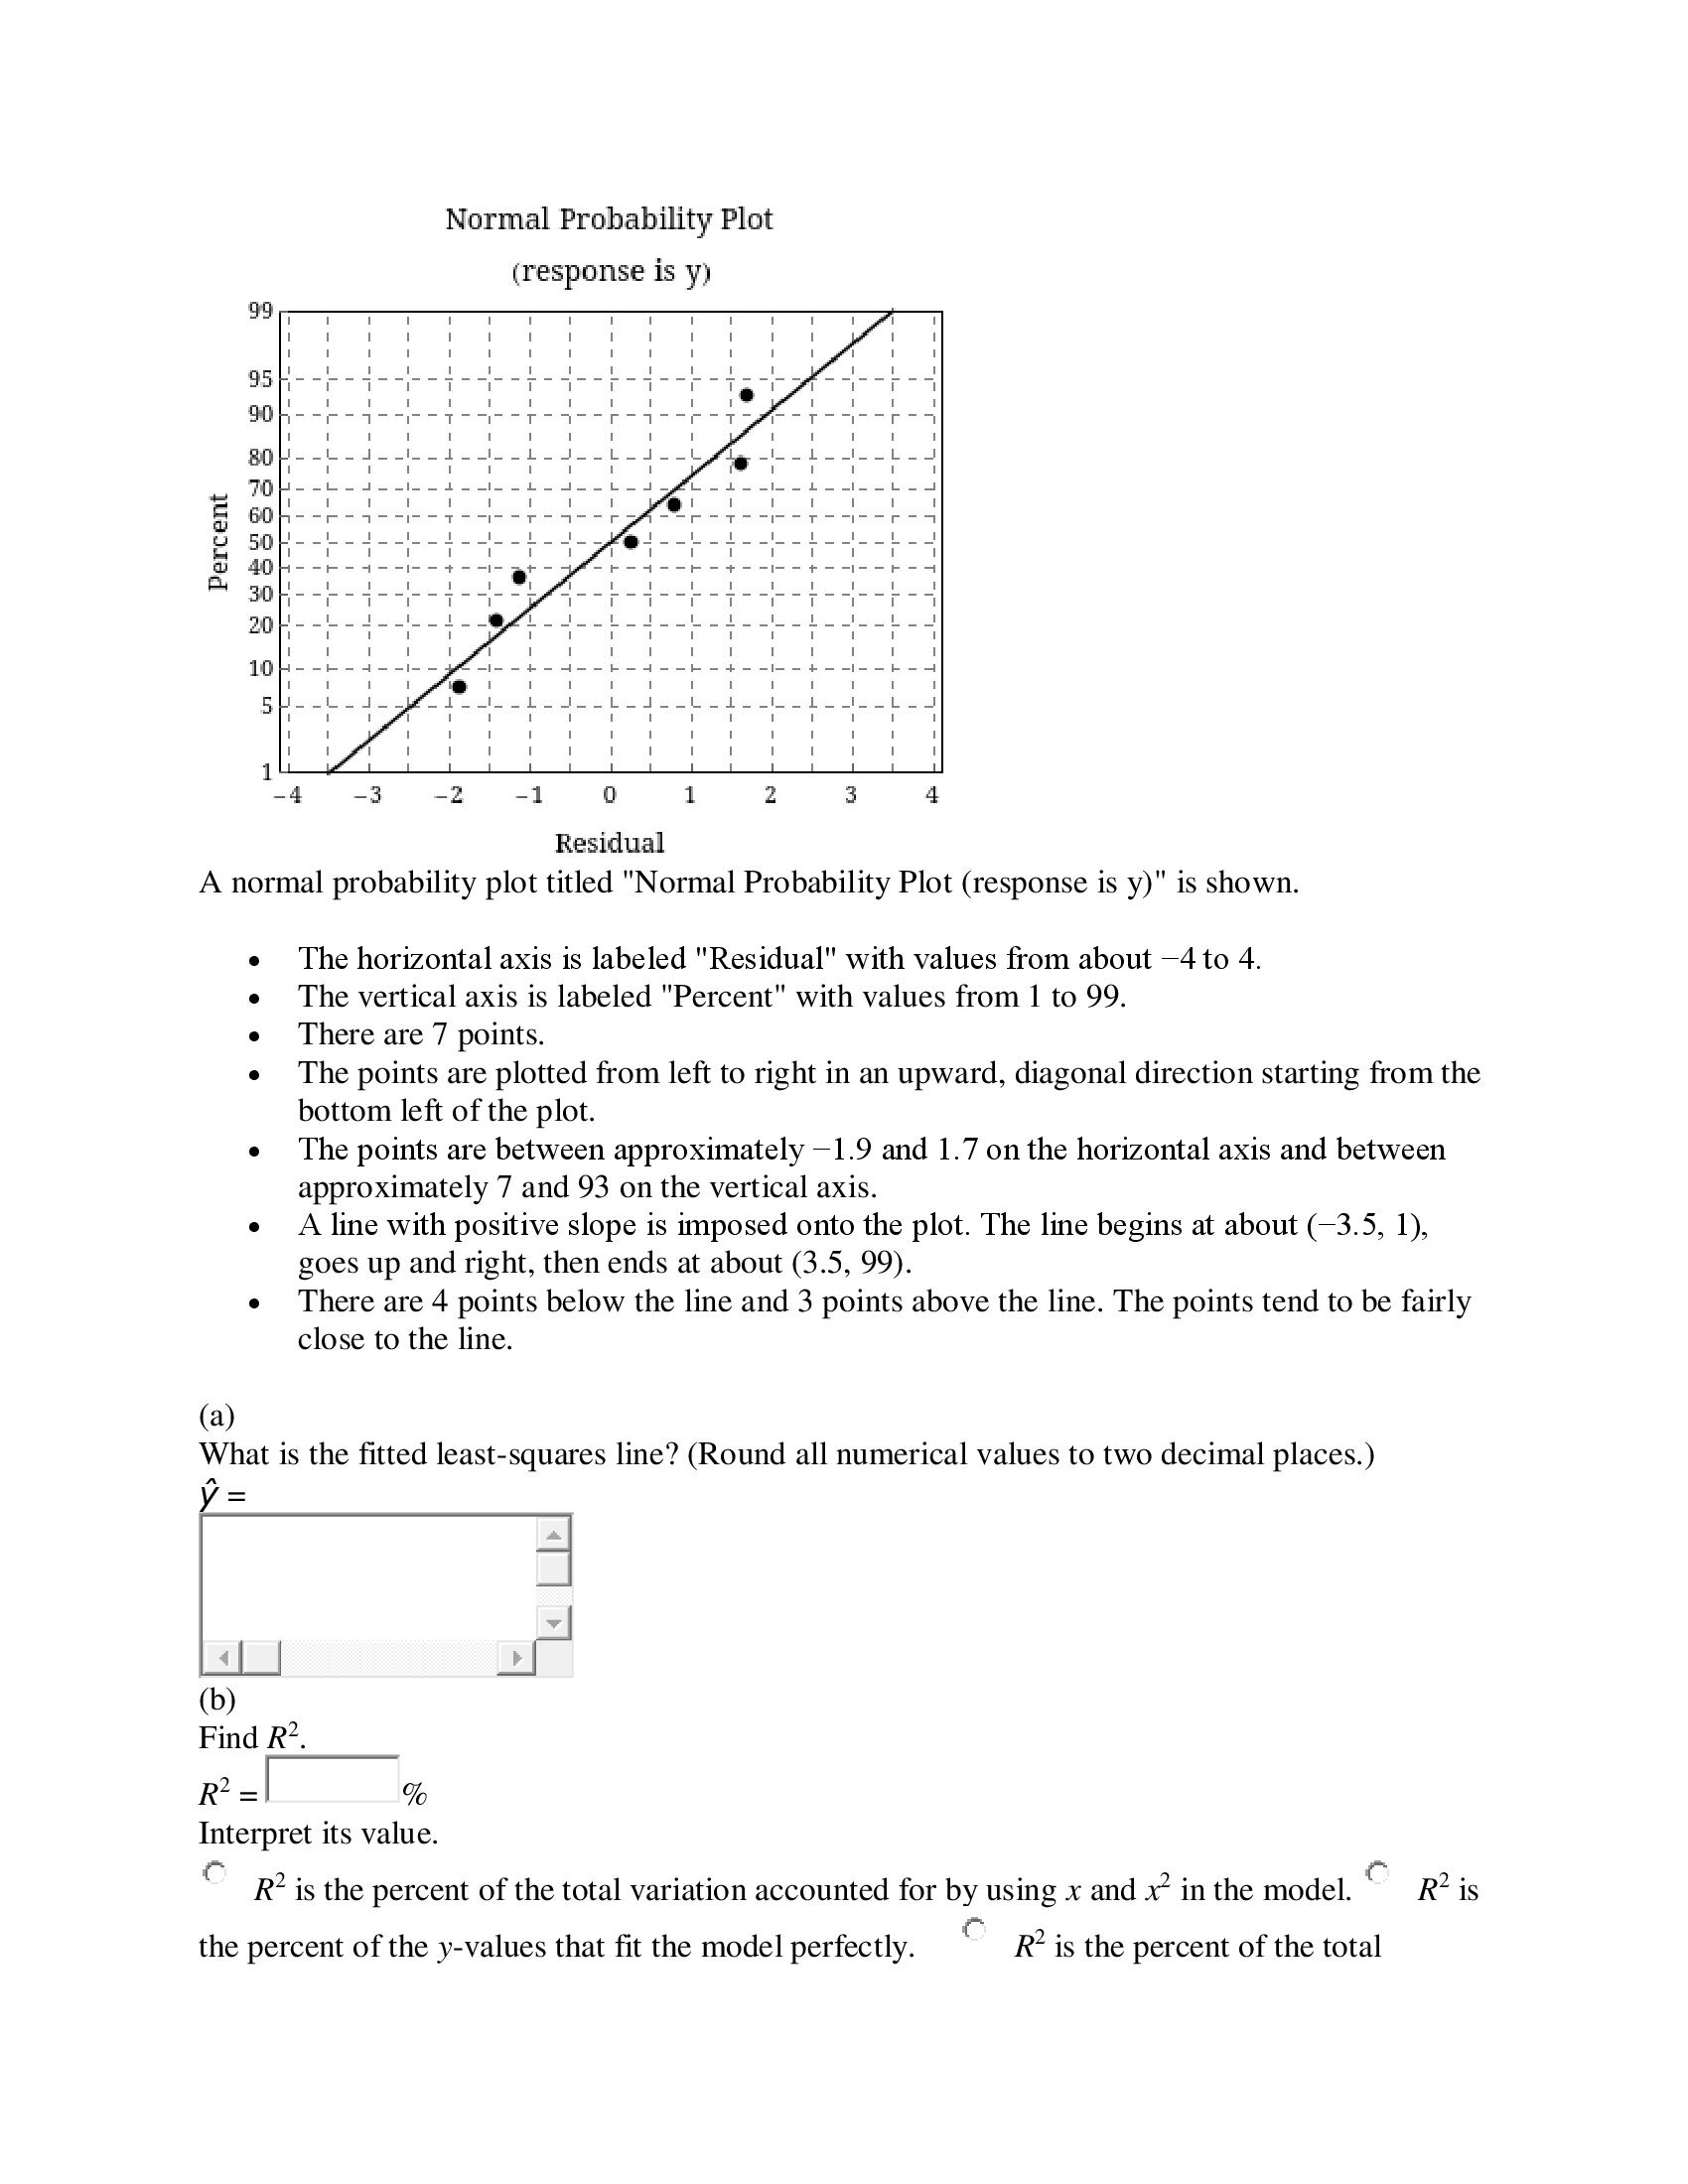
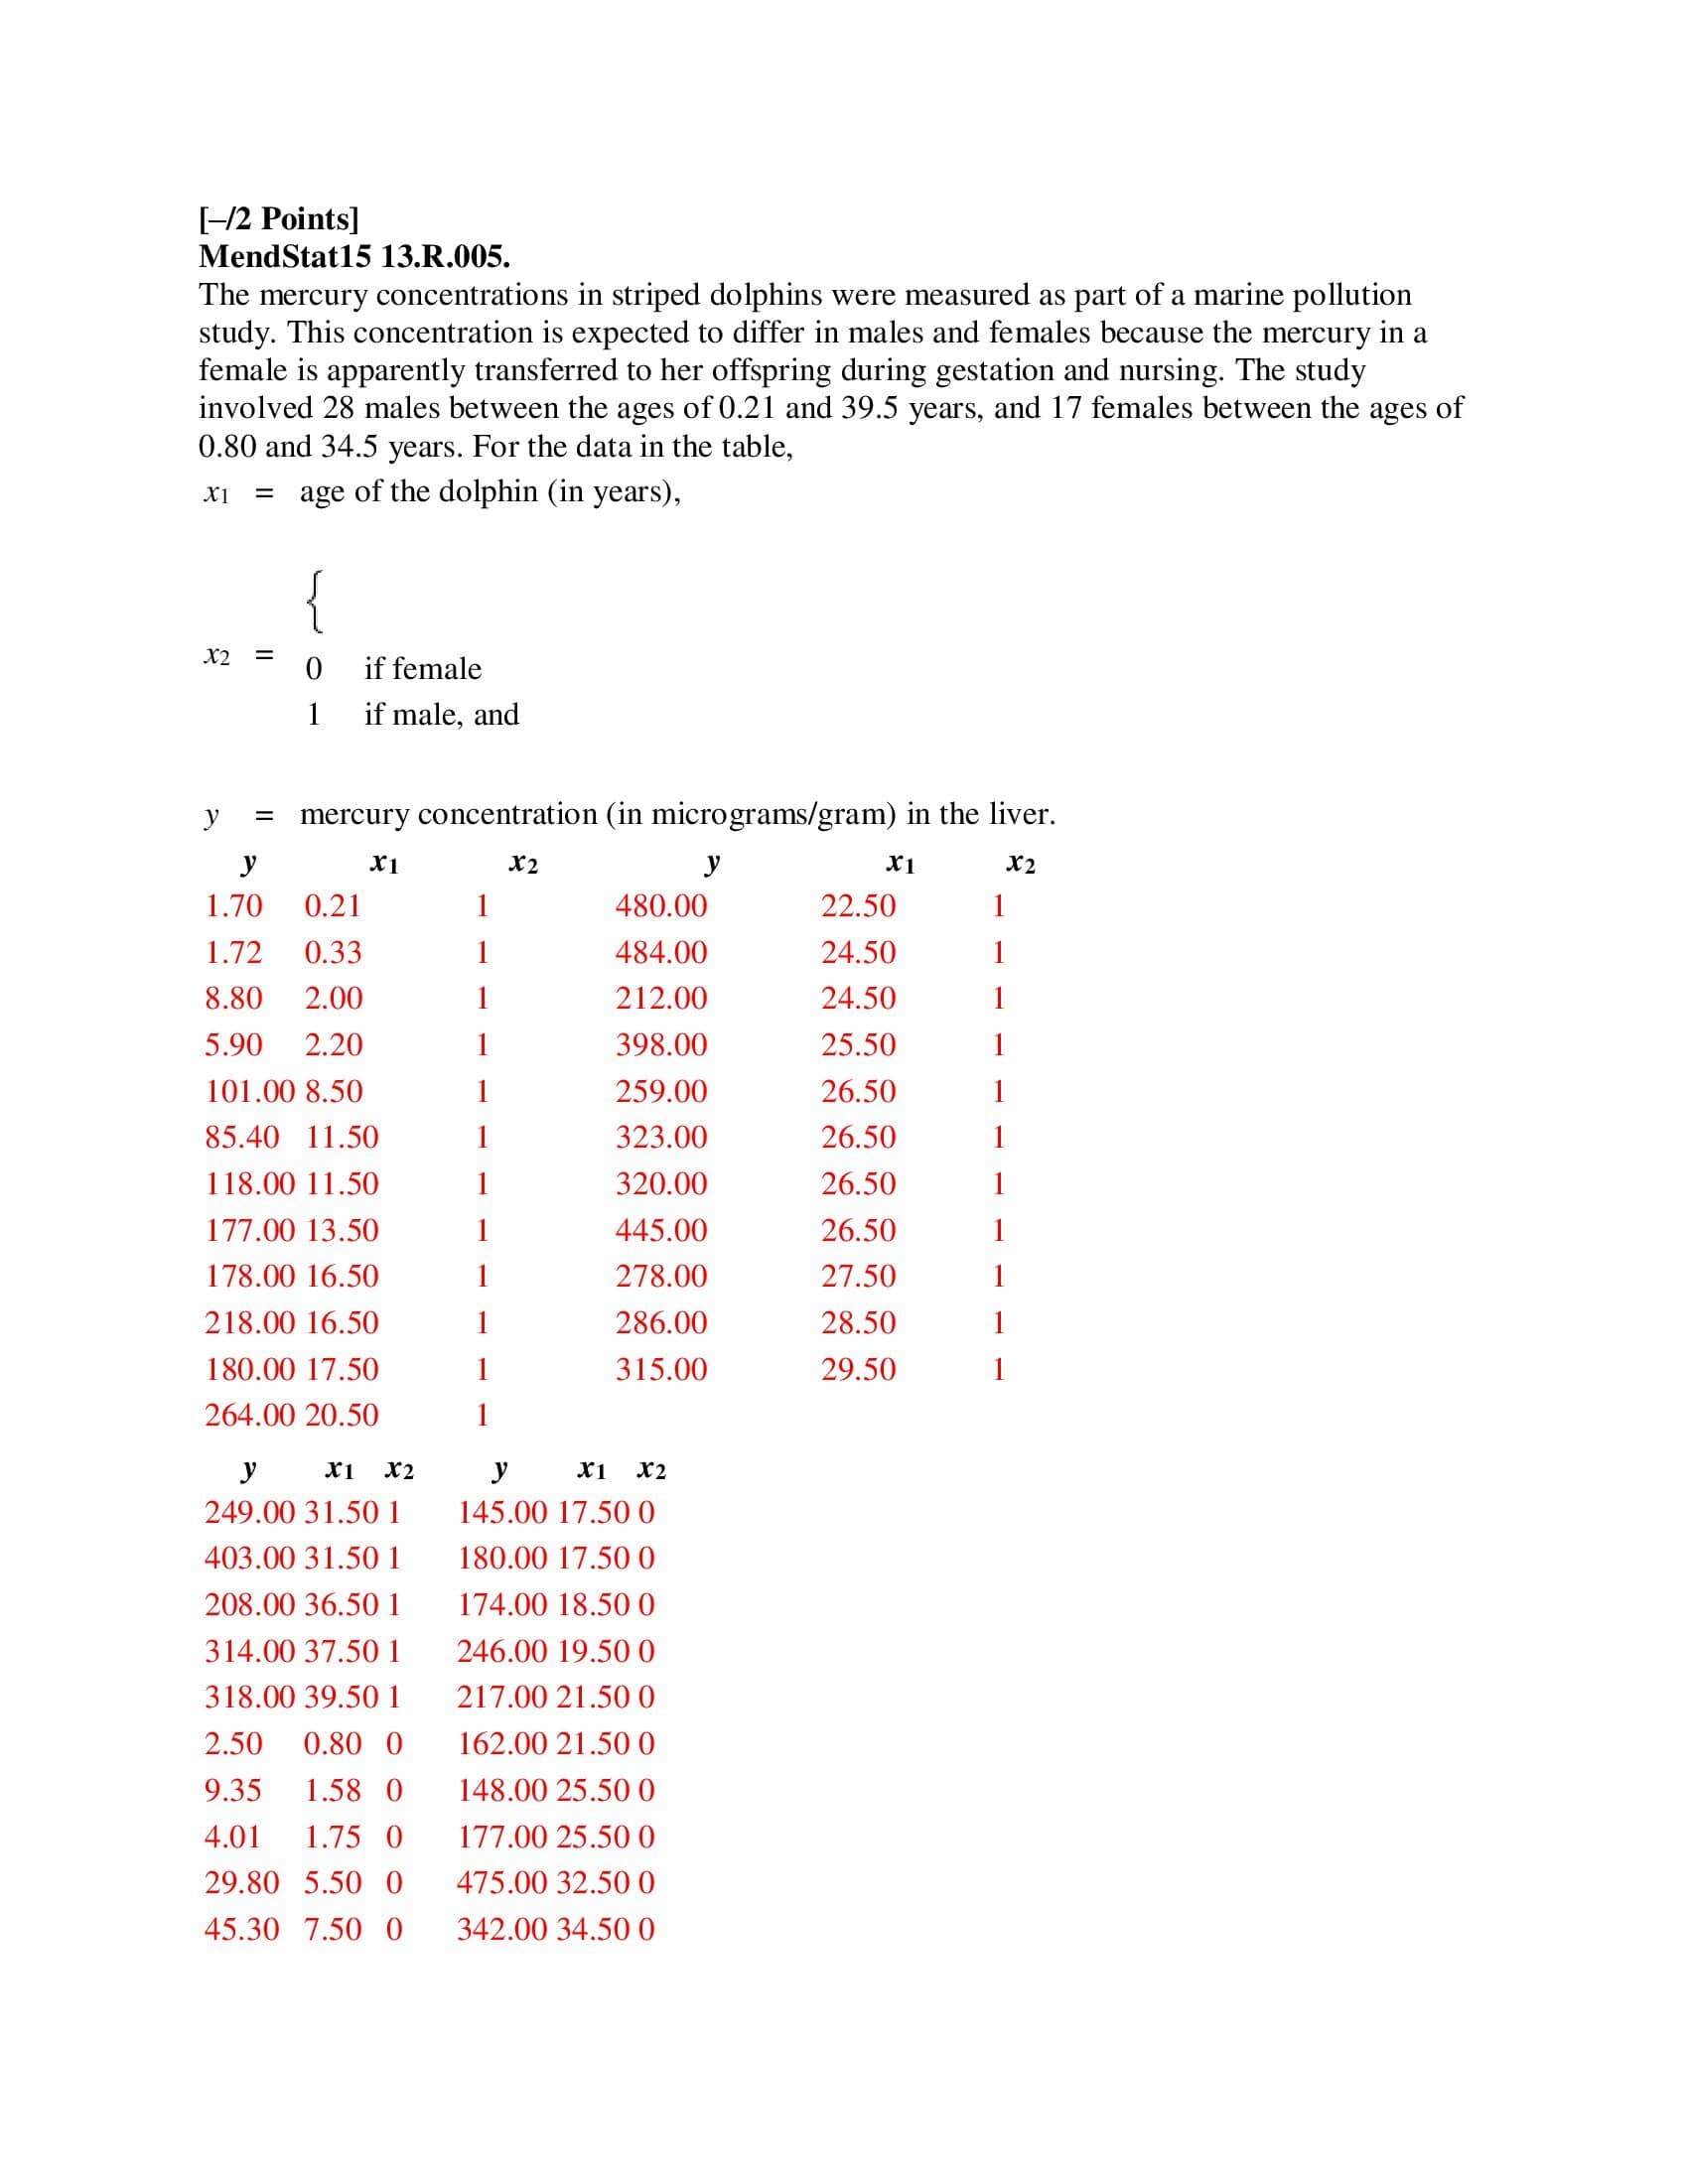
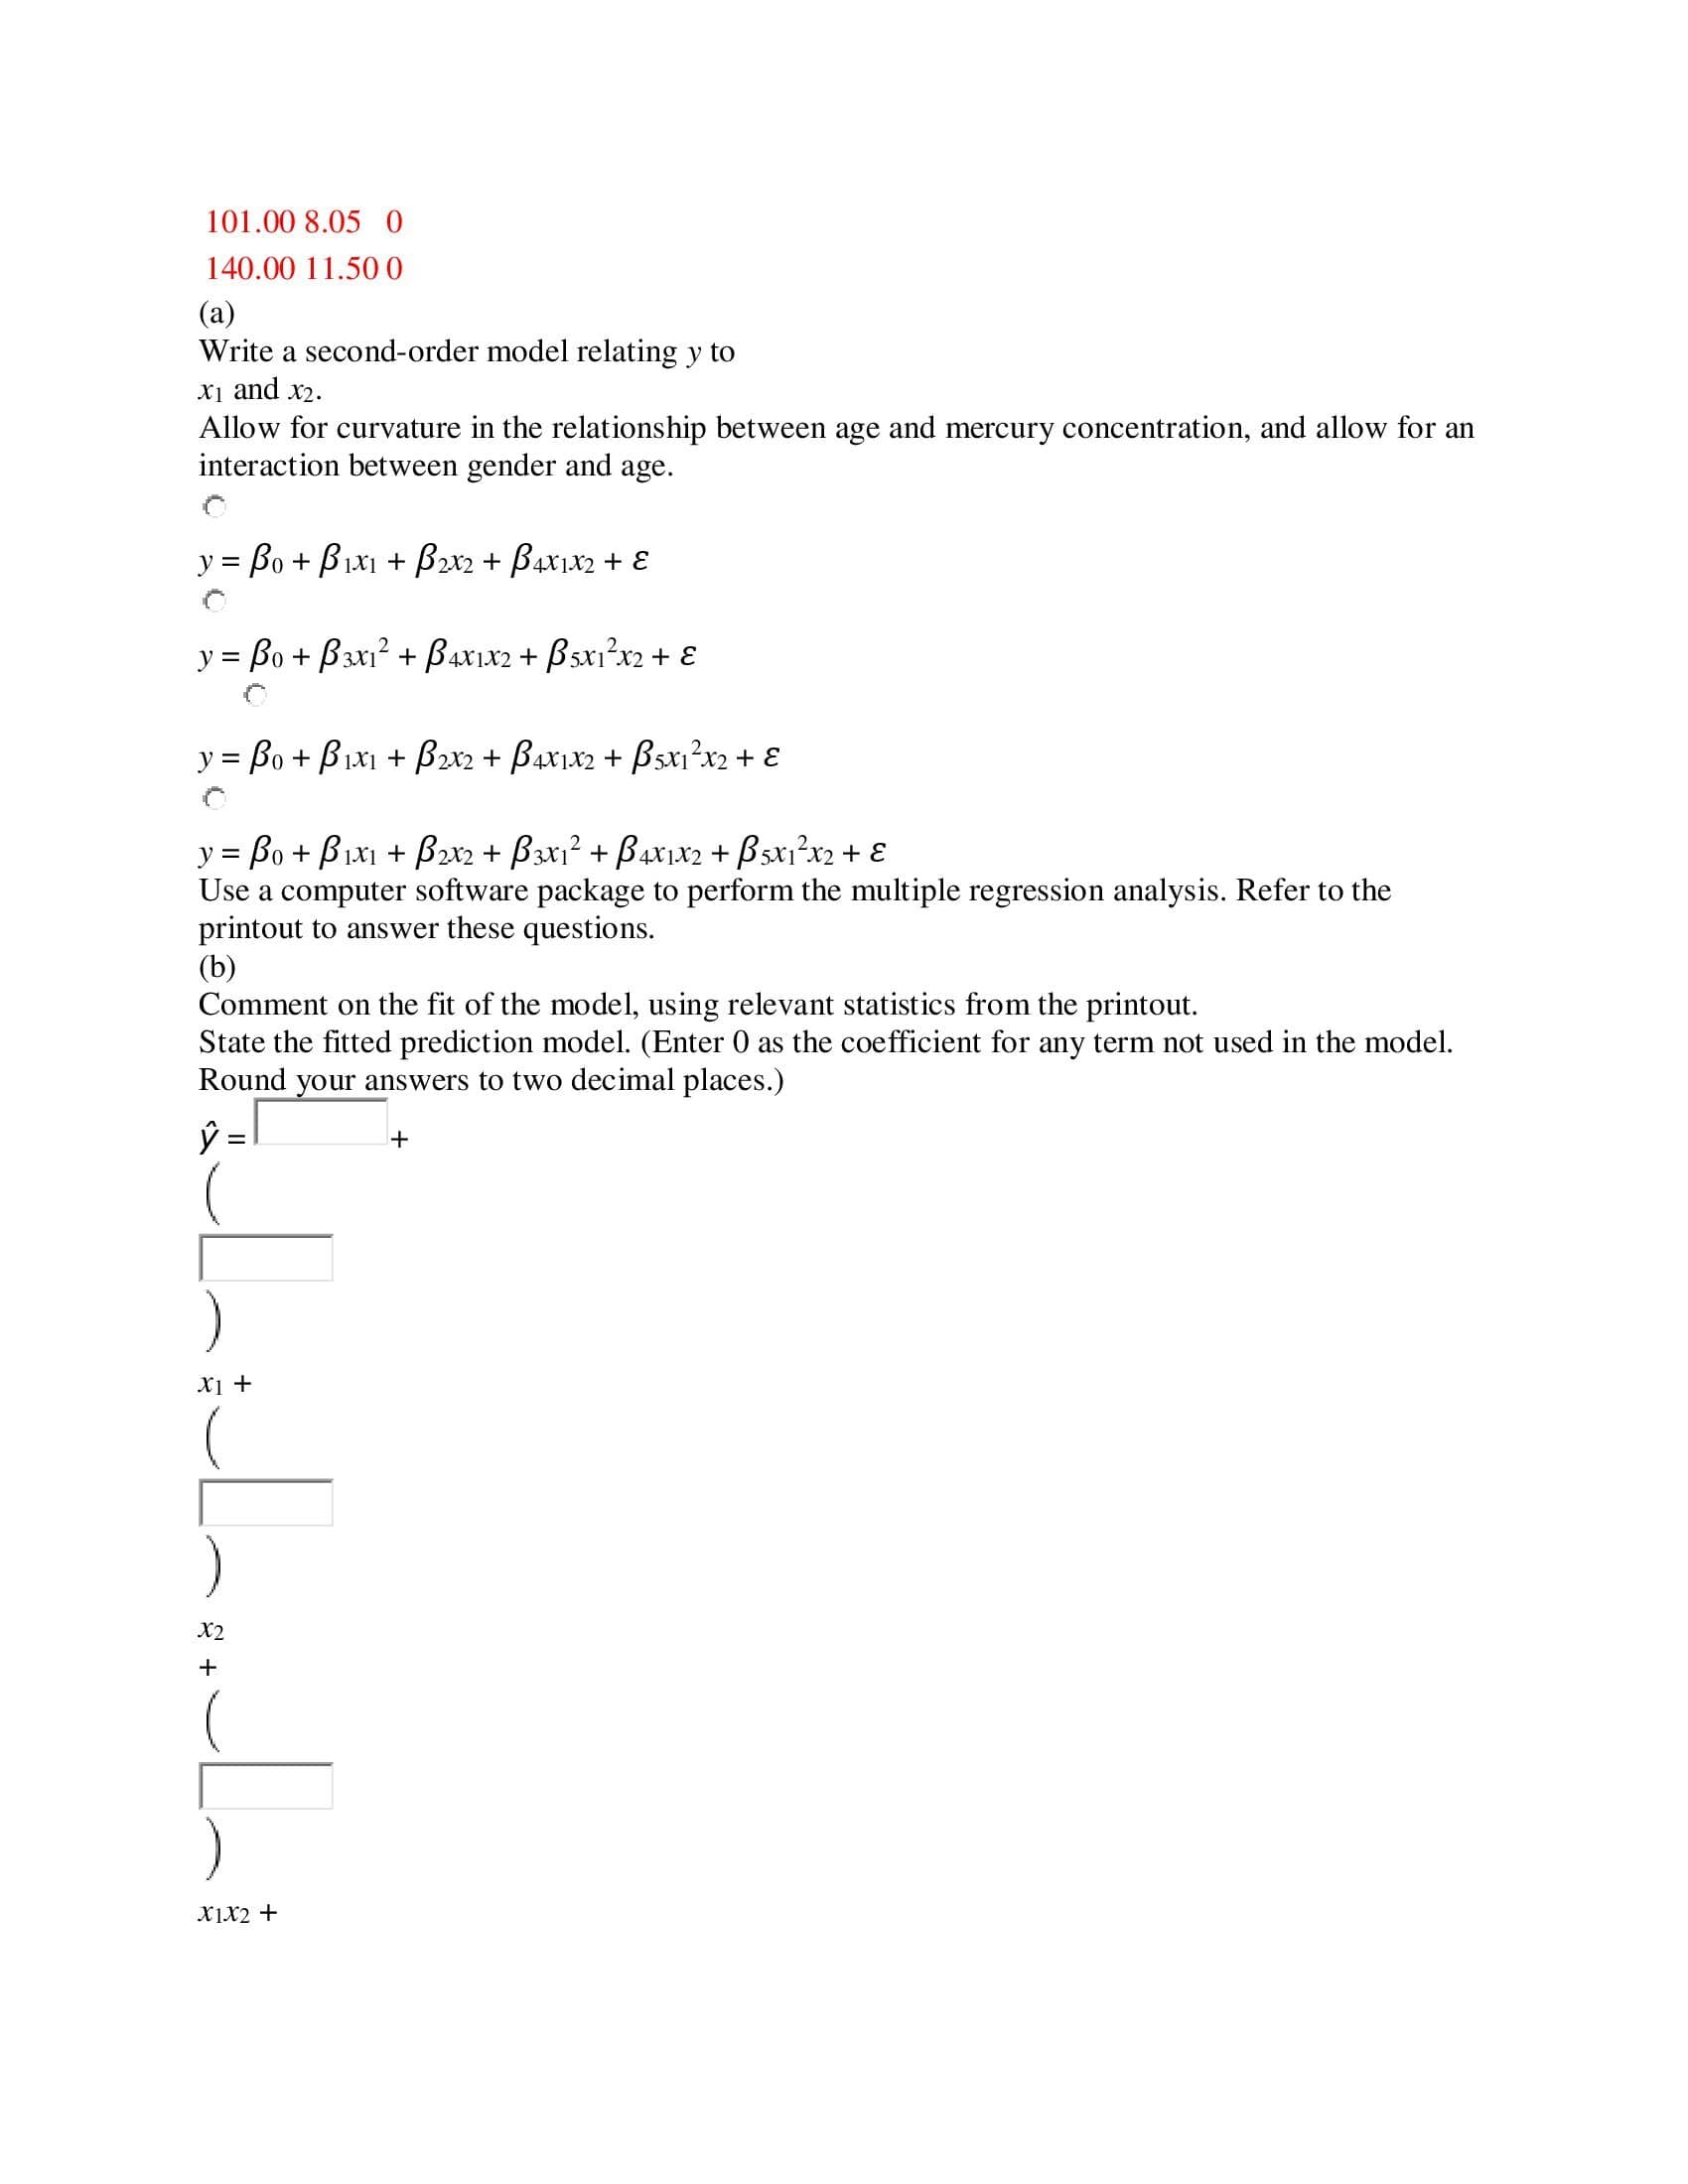
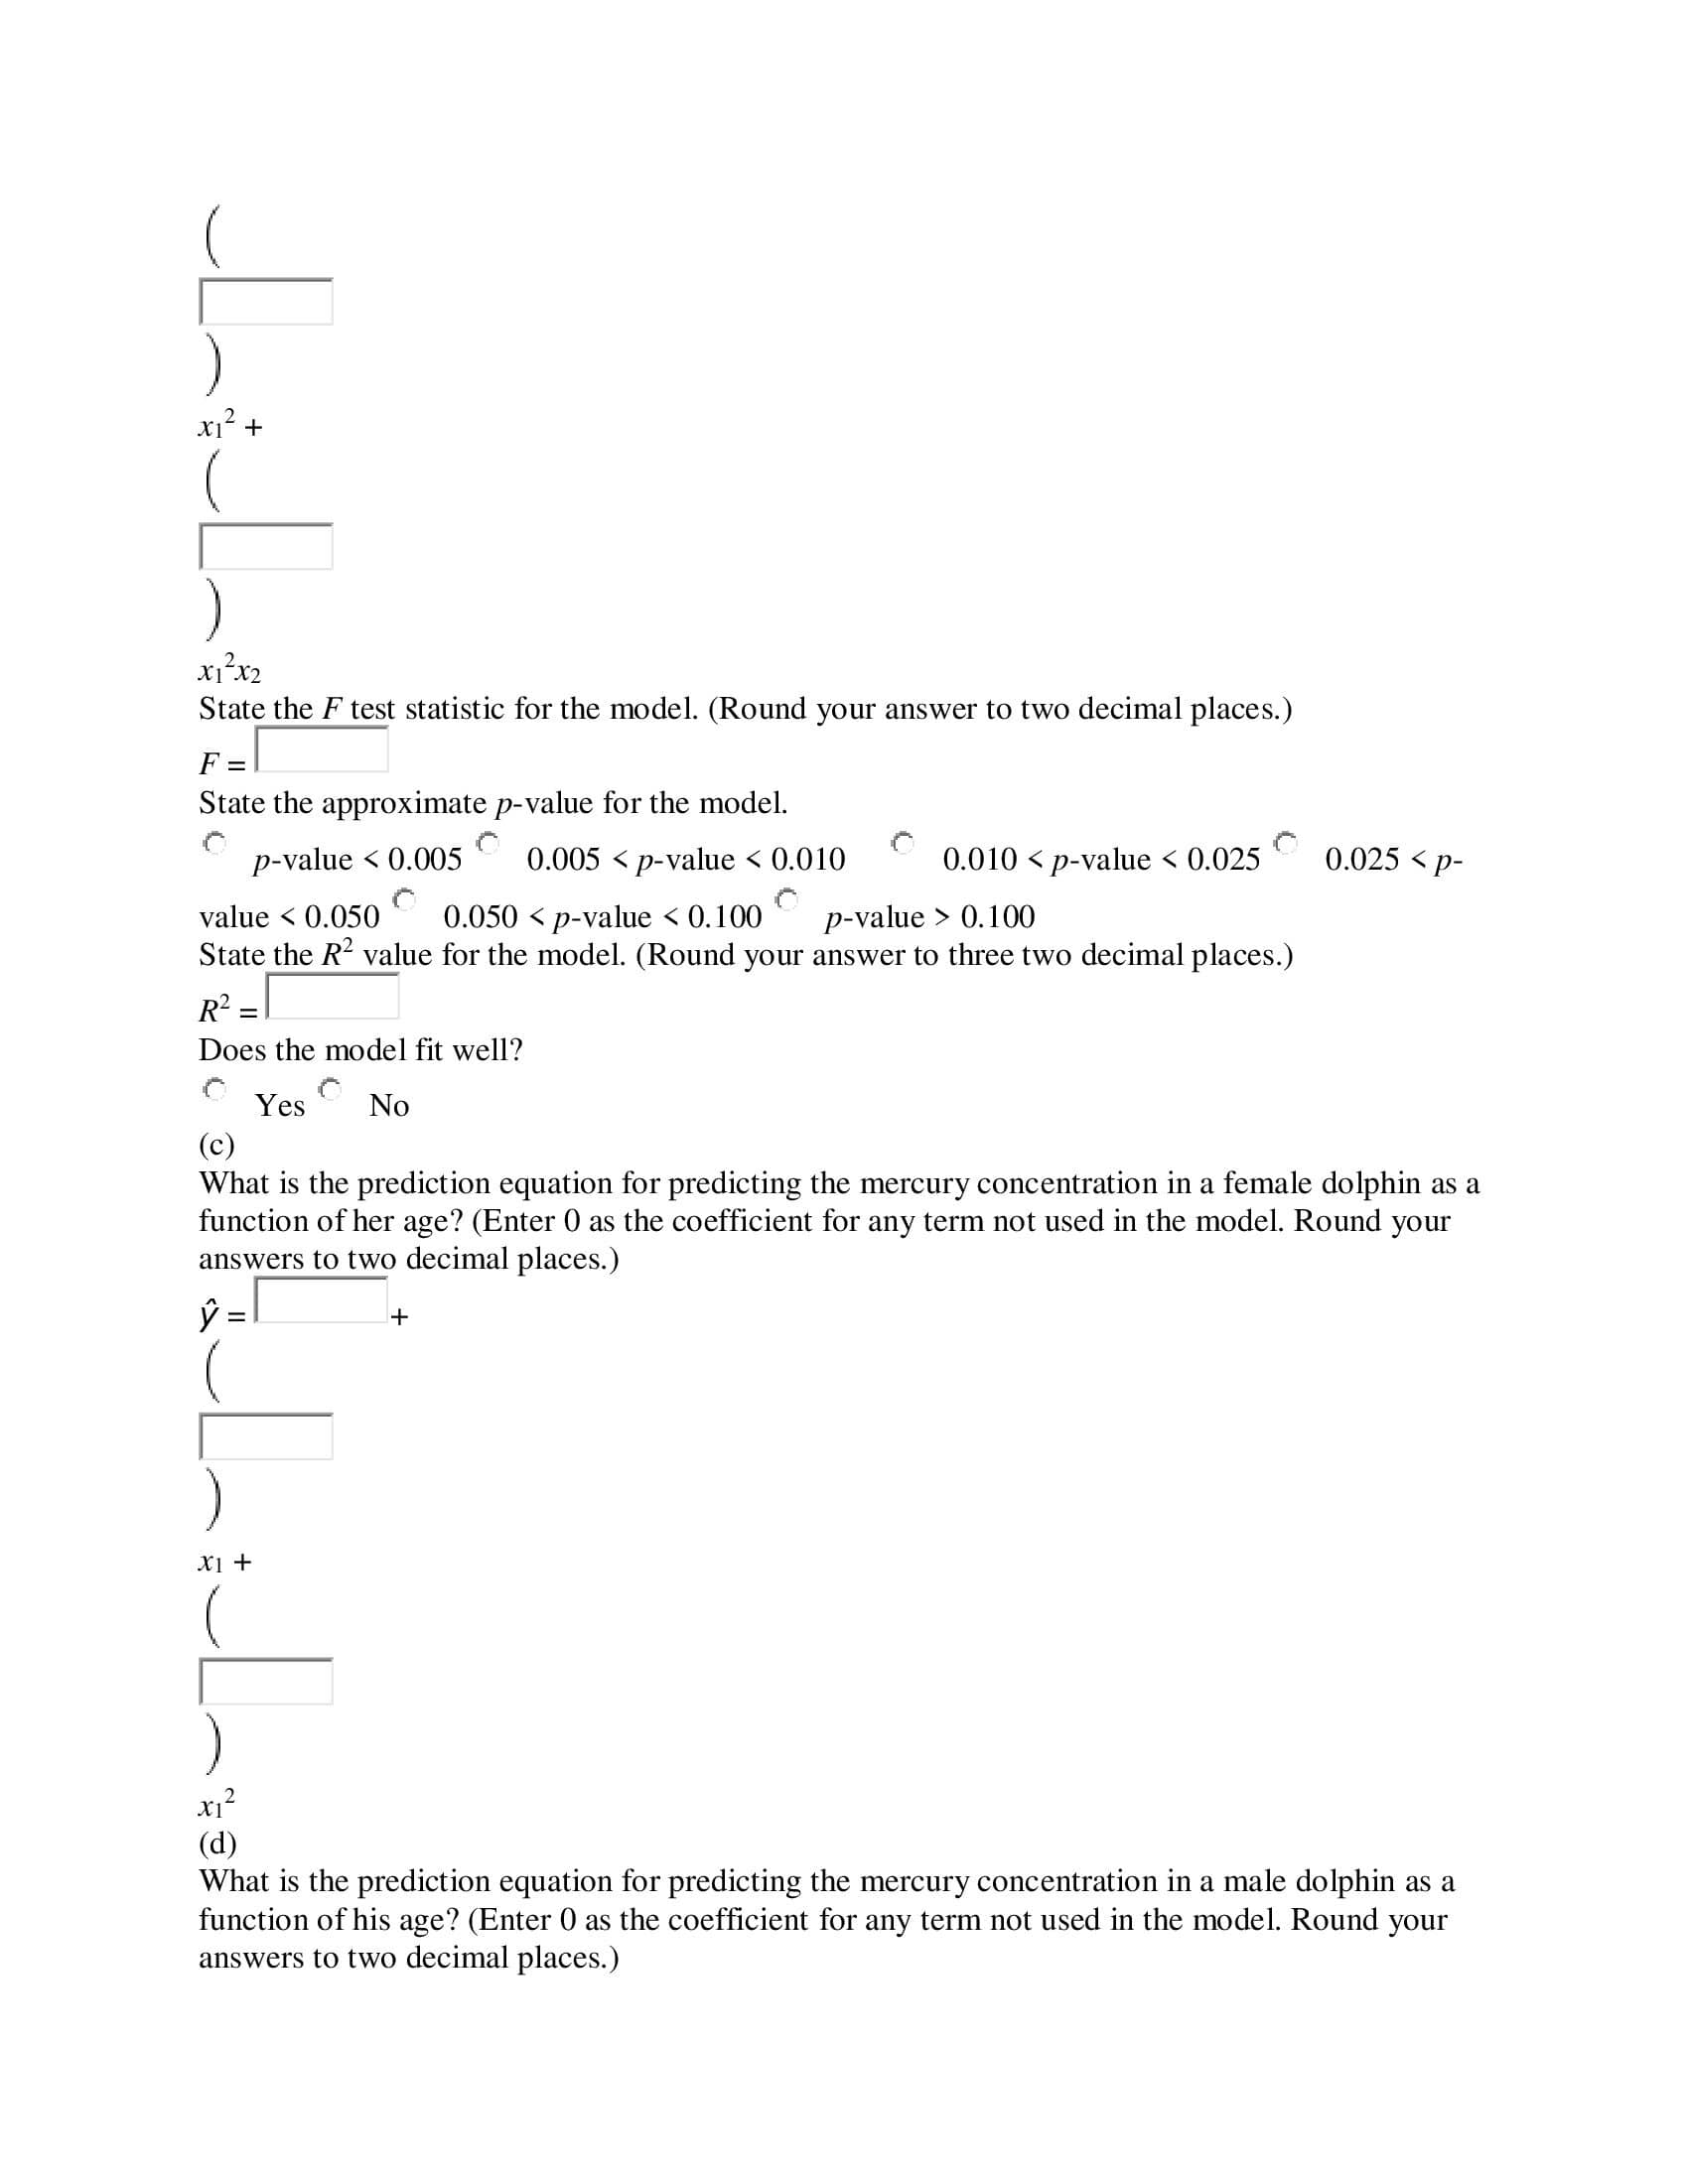
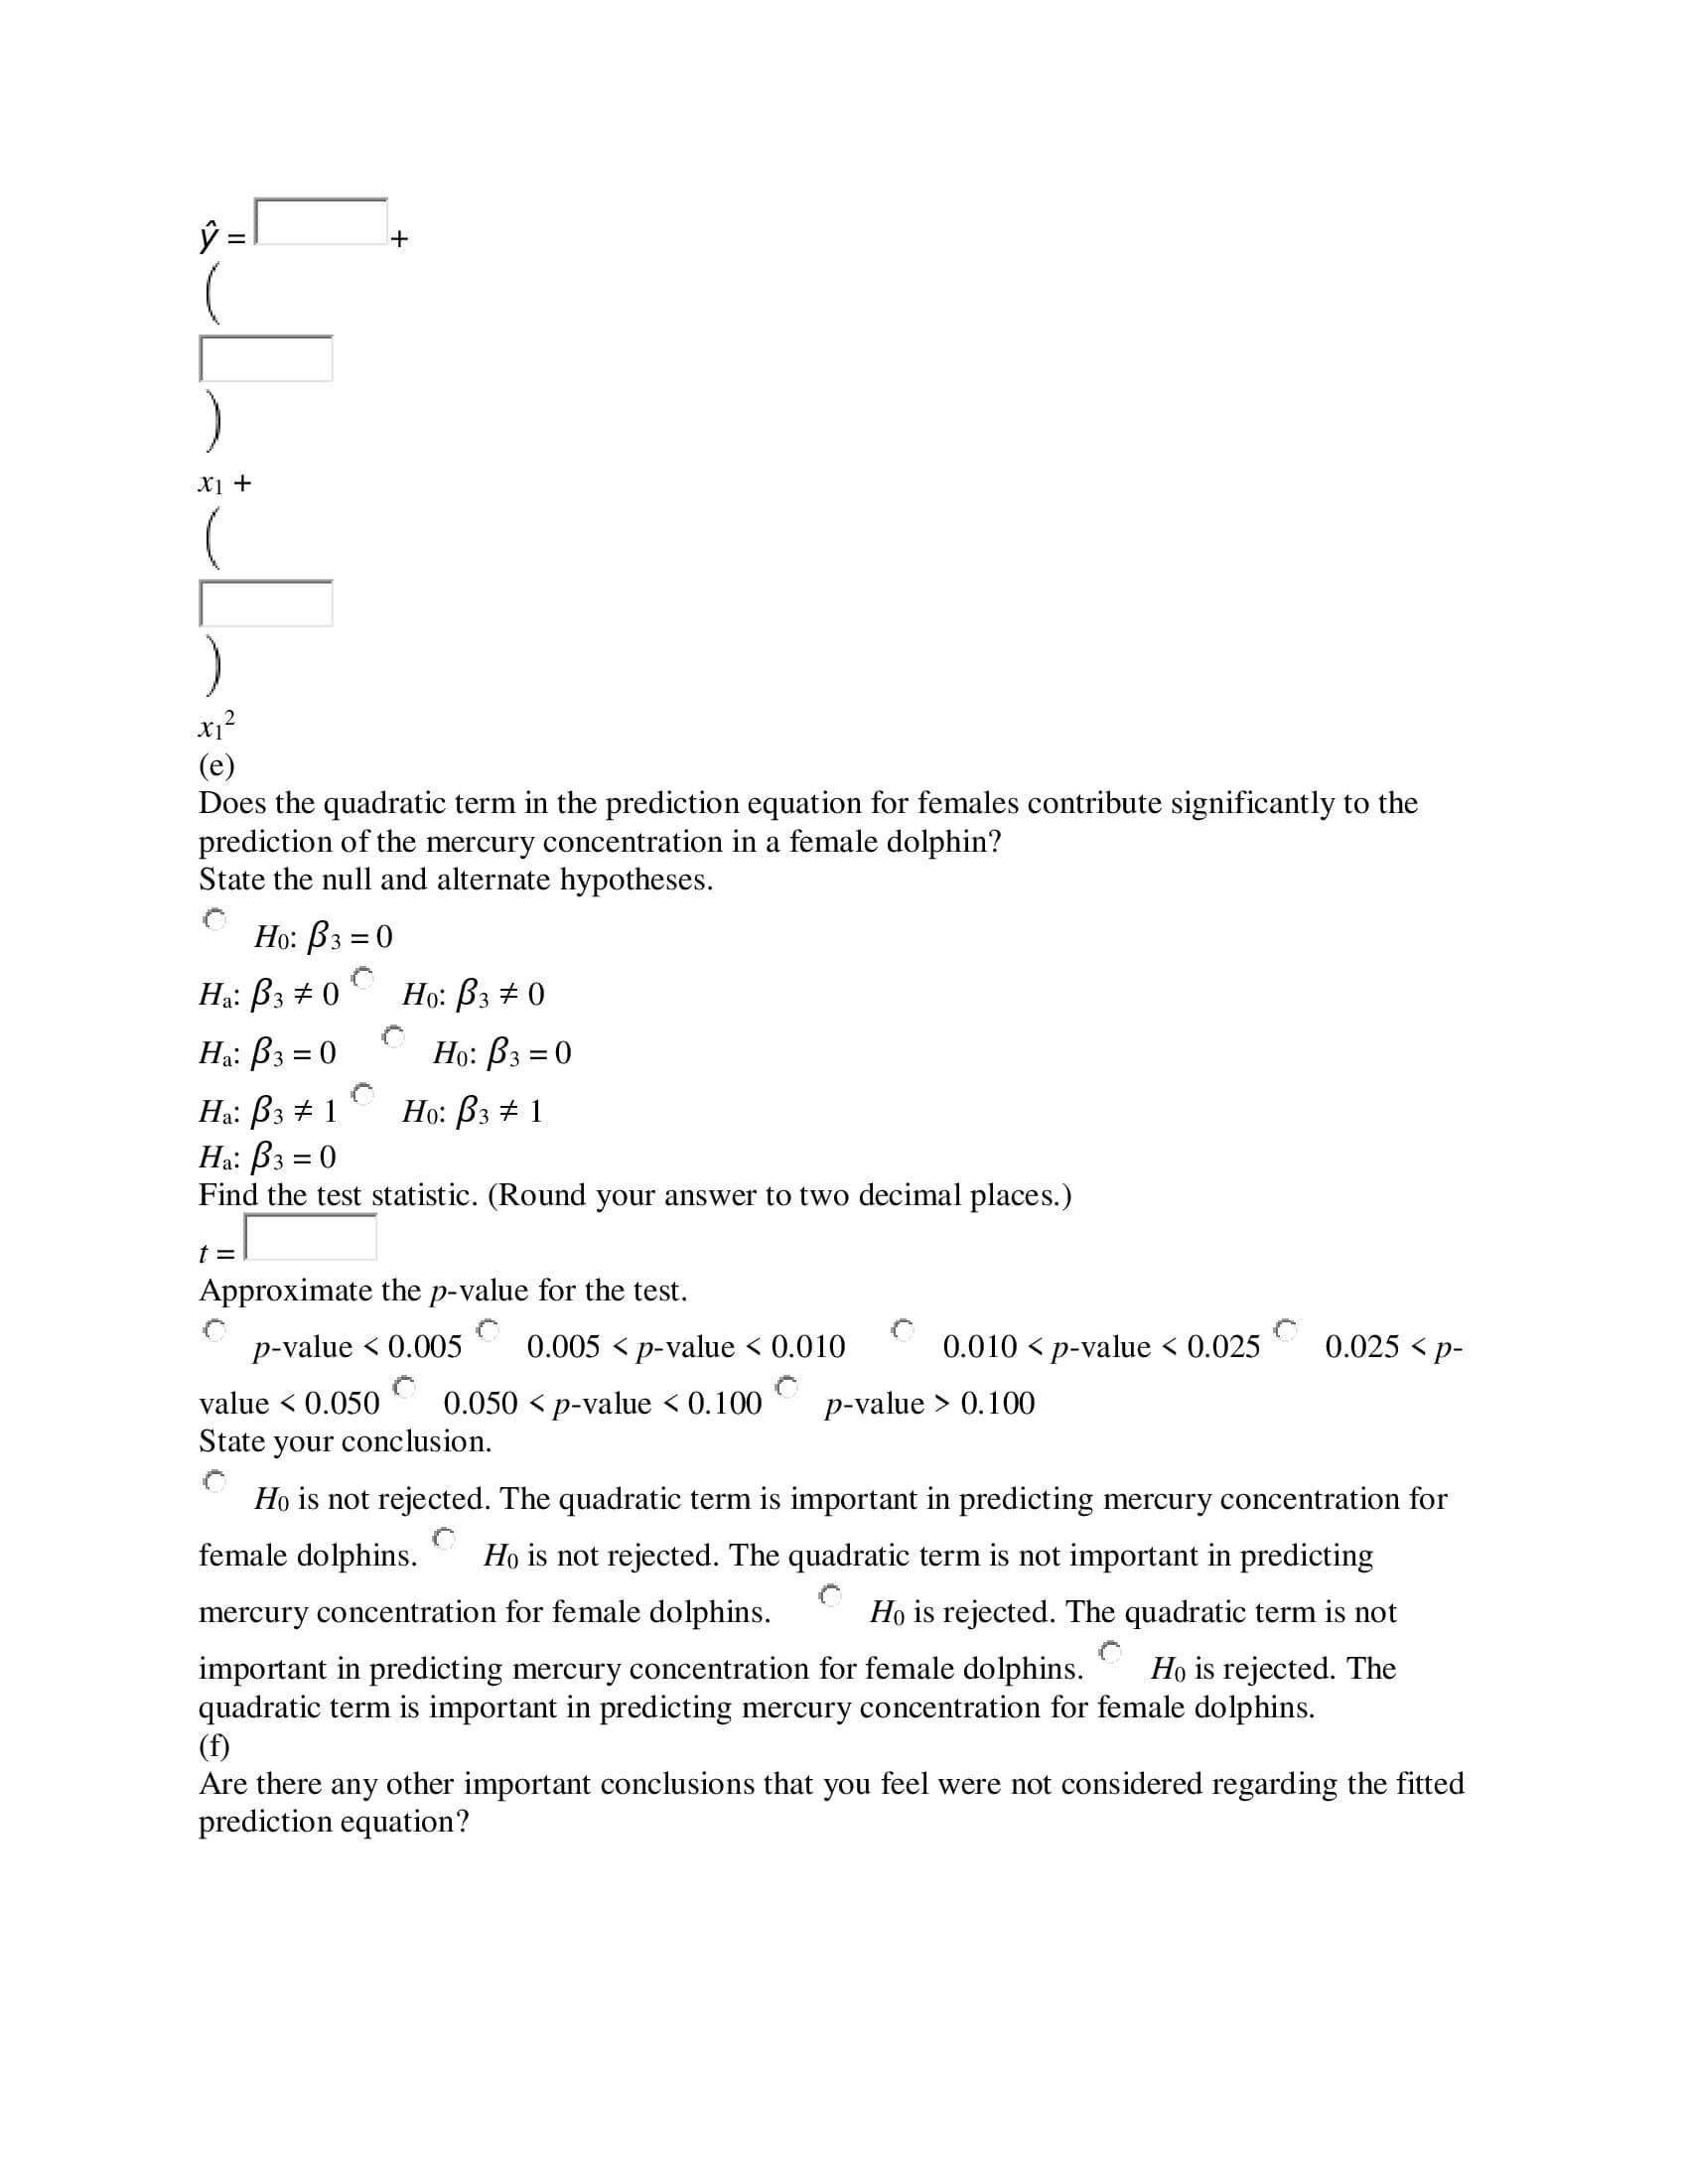
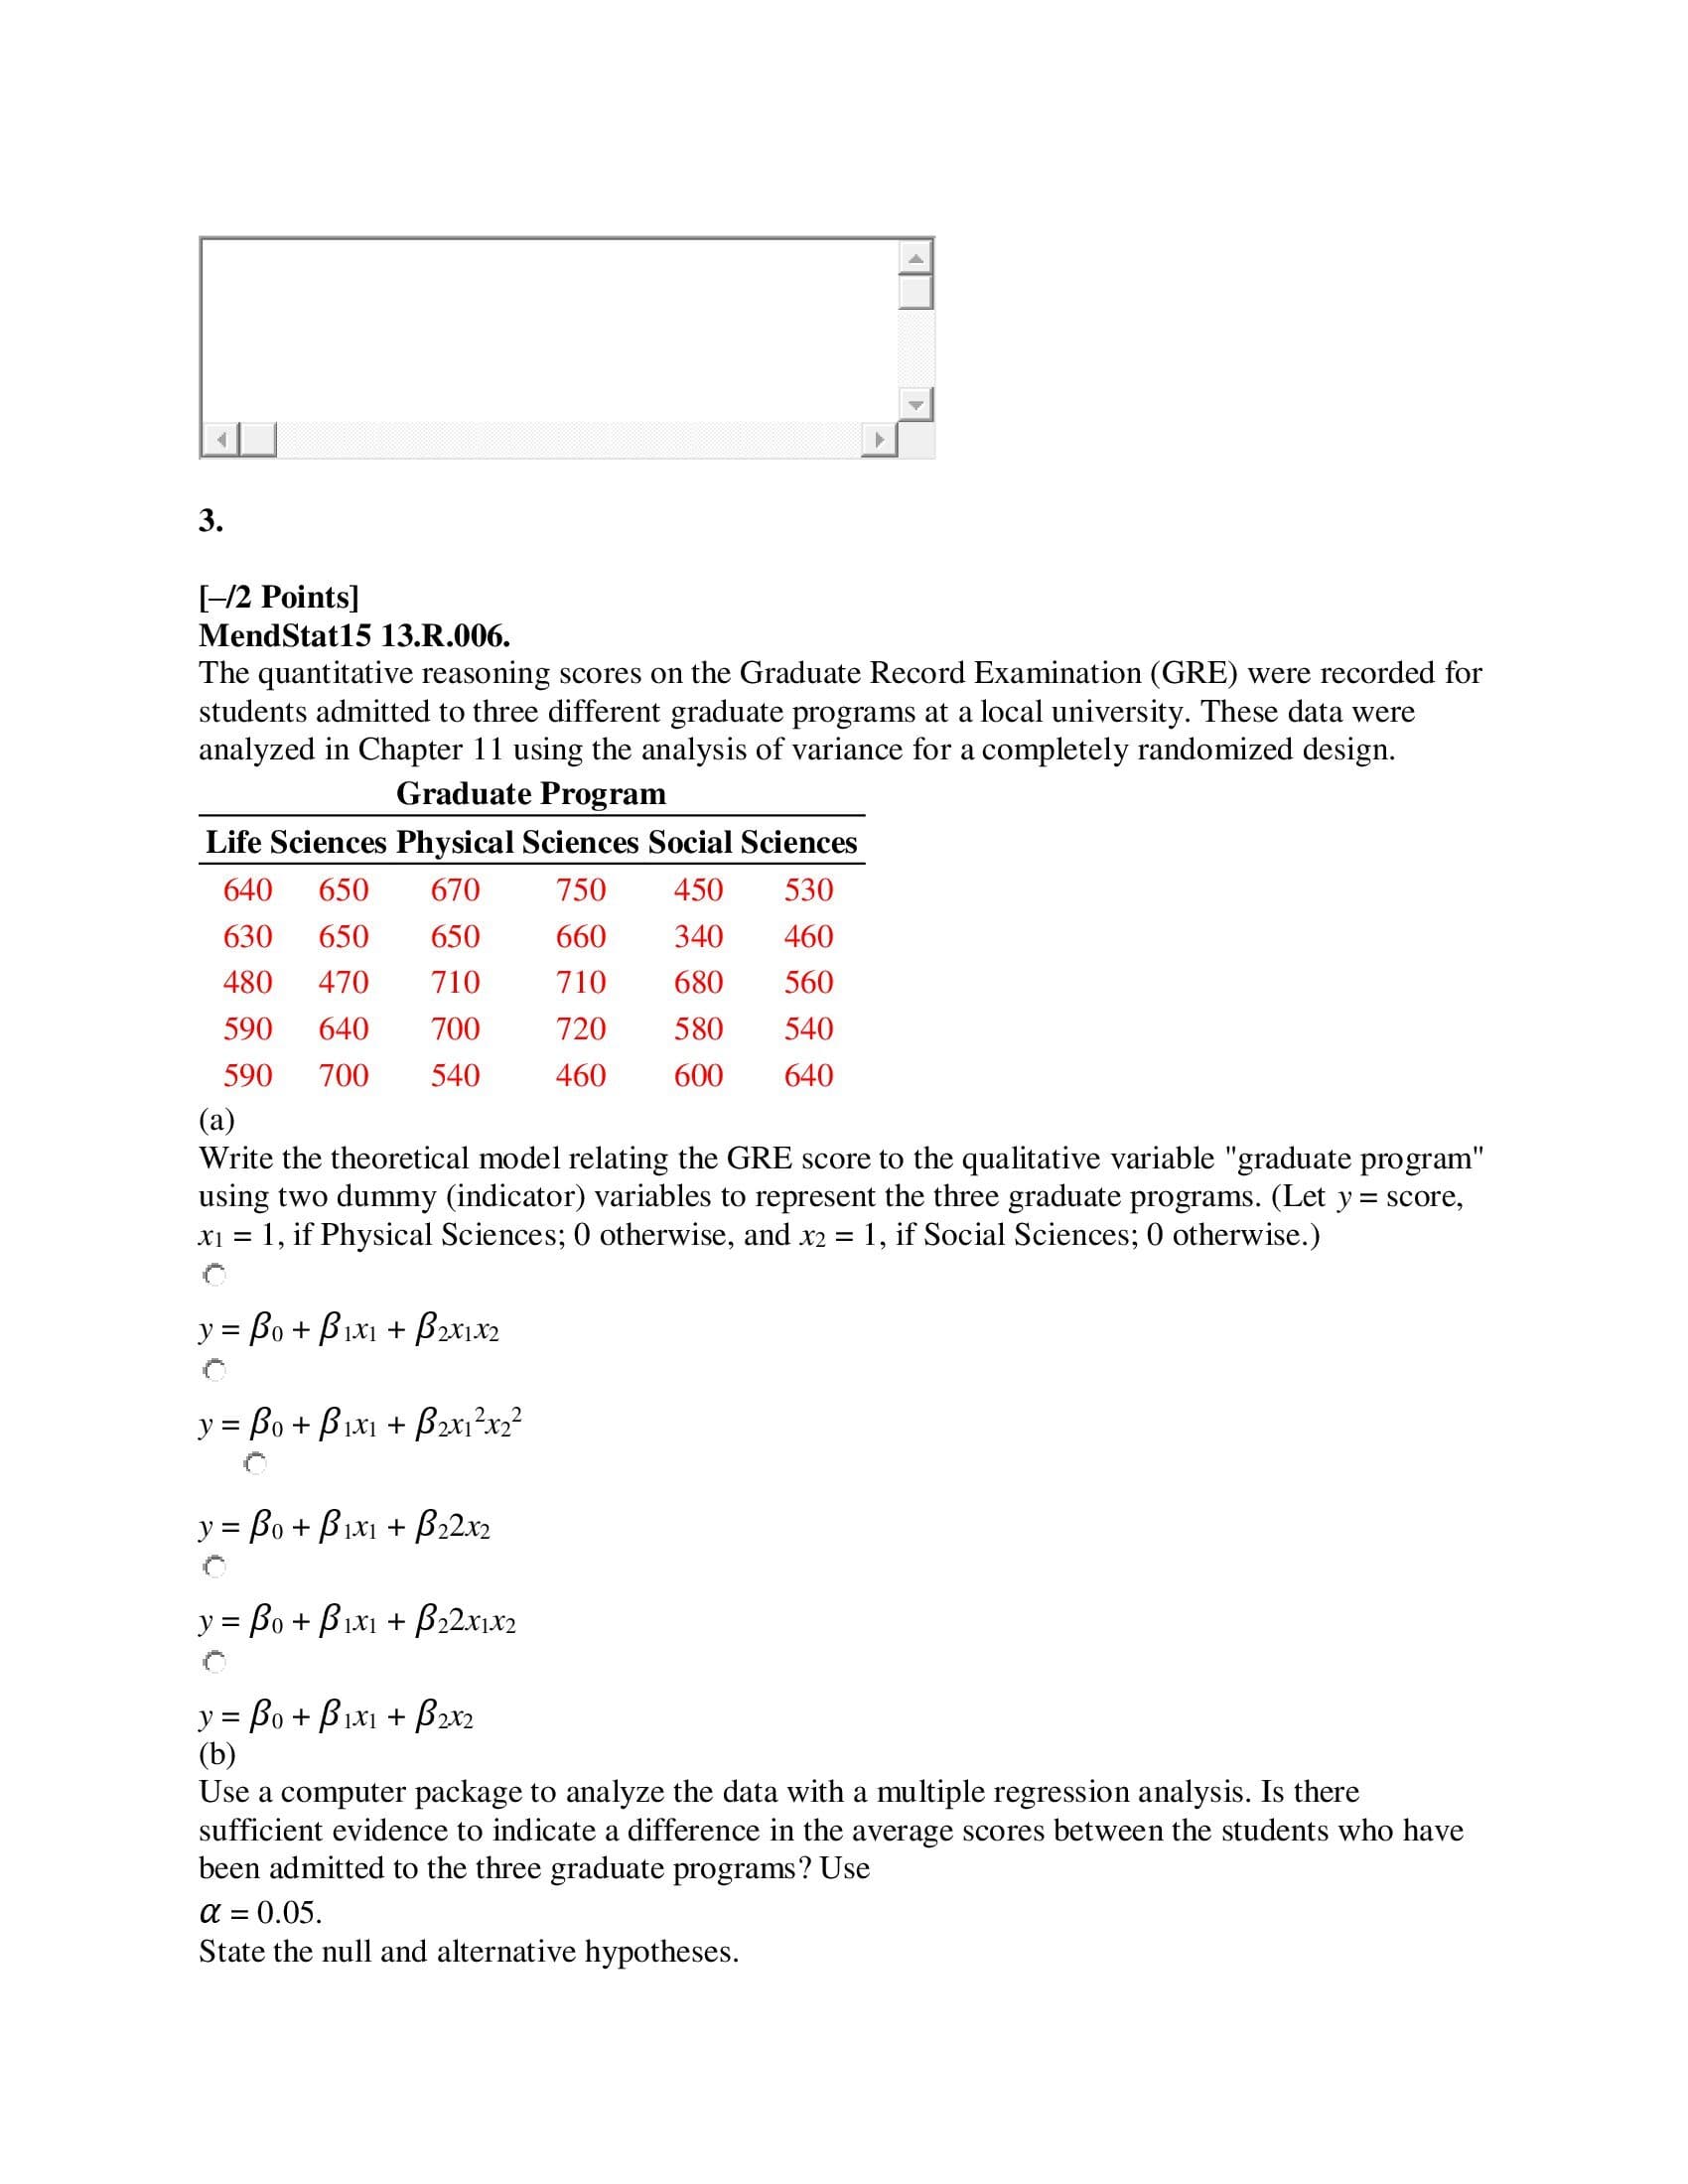
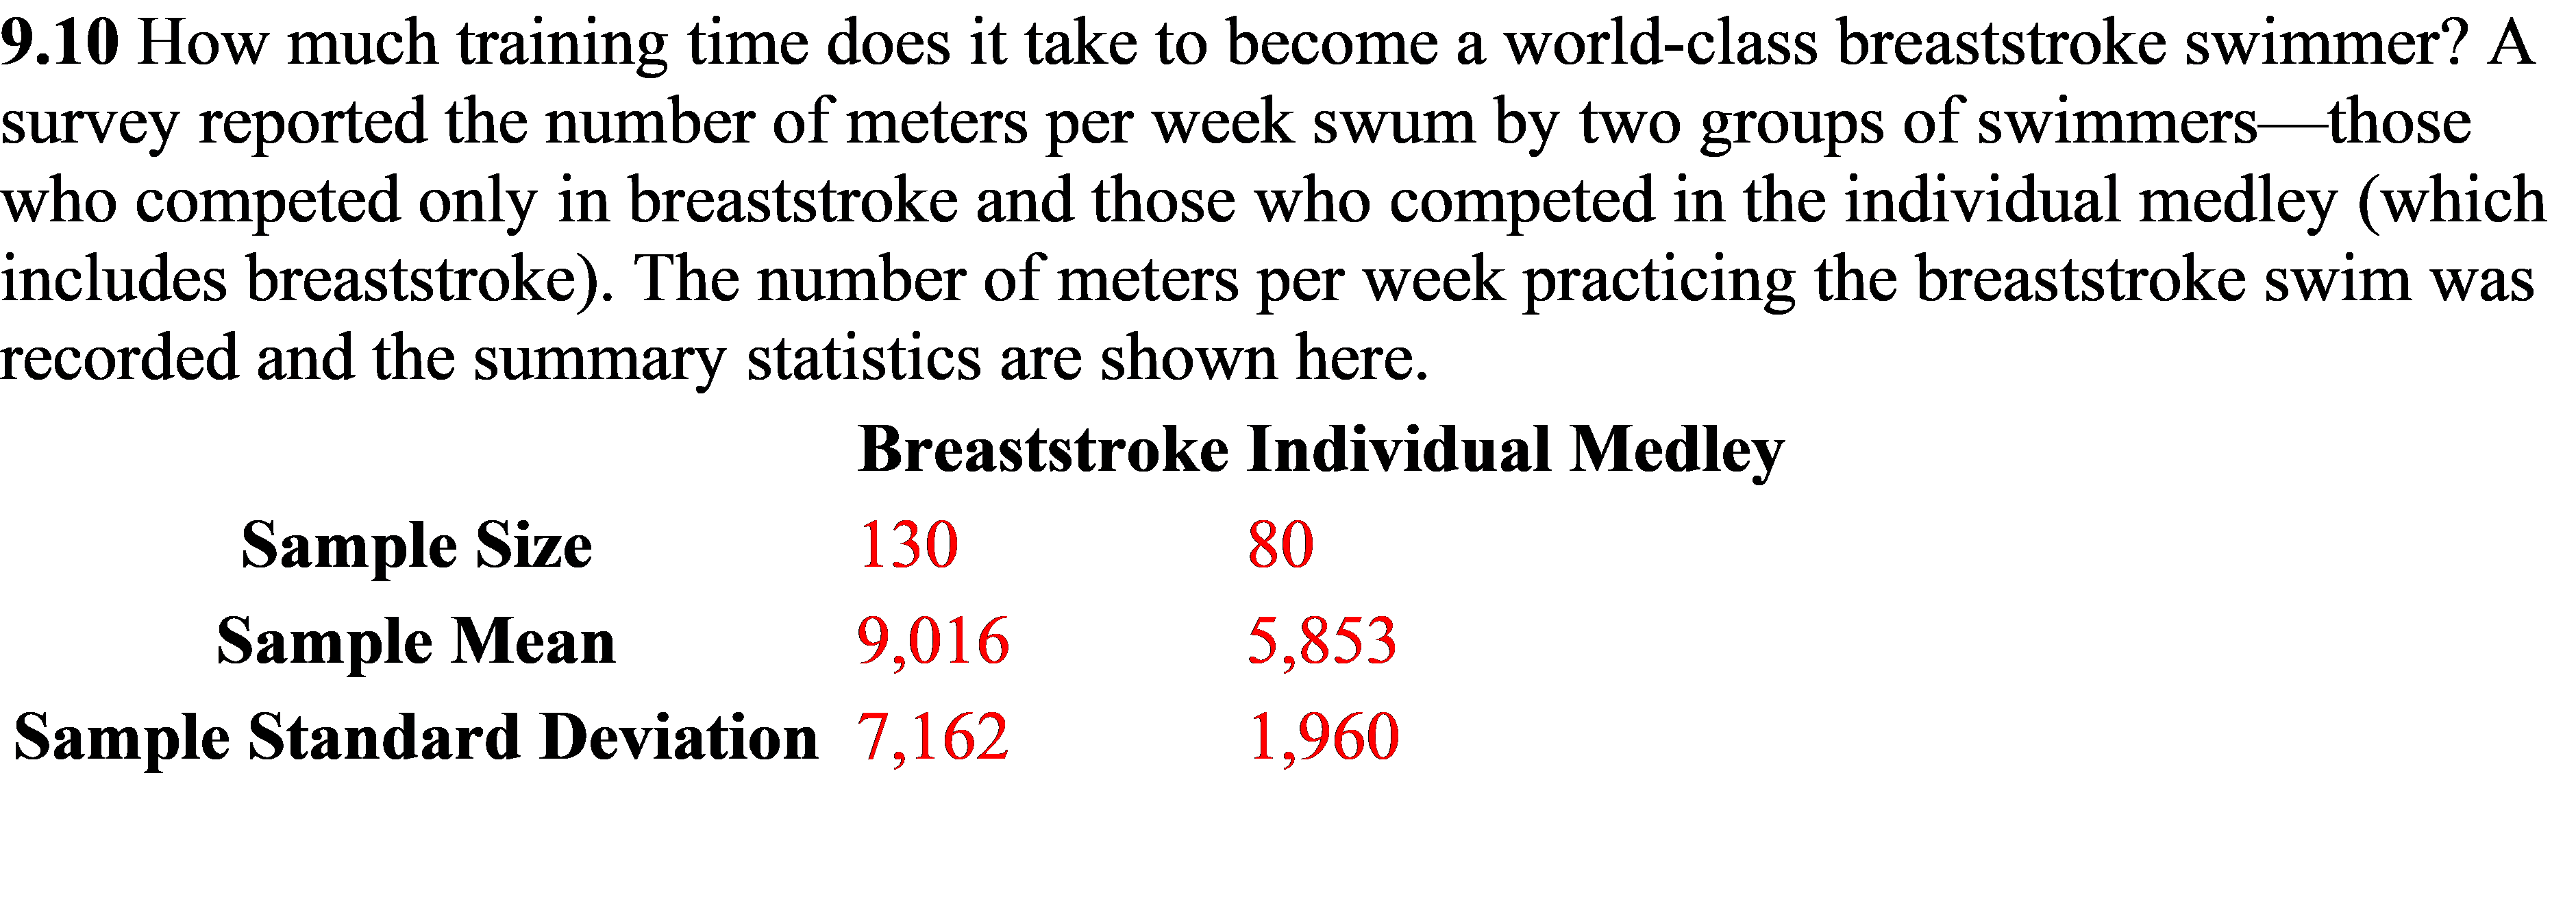
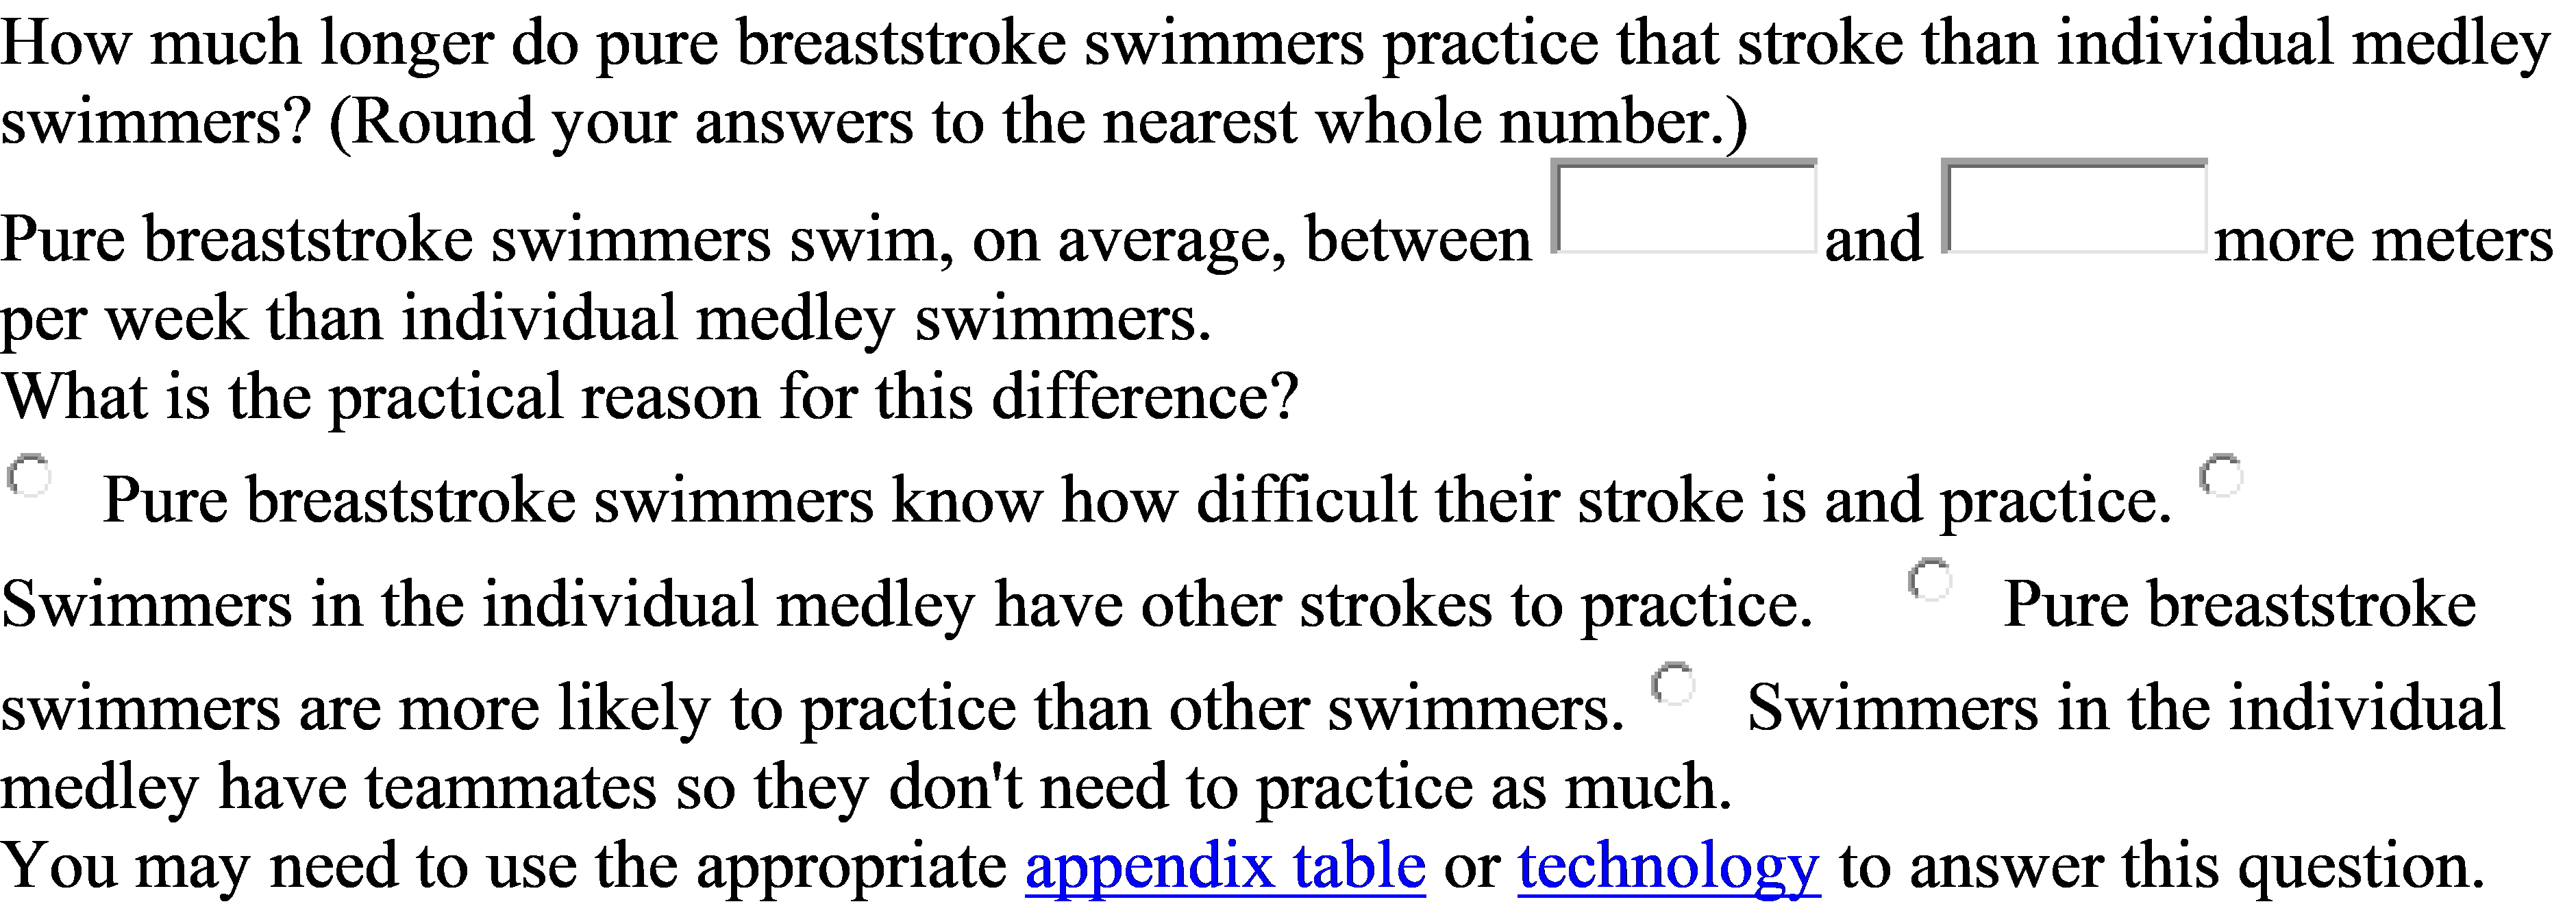
12.5 A researcher devised a scale to measure the freshness of roses that were packaged and stored for varying periods of time before transplanting. The freshness measurement y and the length of time in days that the rose is packaged and stored before transplanting x are given below. x5 10 15 20 25 y15.213.7 9.7 5.41.9 169139 8.8 4.61.1 (d) Estimate the mean rate of change in freshness for a 1-day increase in storage time using a 98% condence interval. (Round your answers to three decimal places.) I tol (e) Estimate the expected freshness measurement for a storage time of 14 days with a 95% condence interval. I tol (f) Of what value is the linear model when compared to y in predicting freshness? (Round your answer to one decimal place.) The total variation has been reduced by I % by using the linear model. Assignment Submission For this assignment, you submit answers by question parts. The number of submissions remaining for each question part only changes if you submit or change the answer. Assignment Scoring Your last submission is used for your score. 1. [-/2 Points] MendStat15 13.R.001. Groups of 10-day-old chicks were randomly assigned to seven treatment groups in which a basal diet was supplemented with 0, 50, 100, 150, 200, 250, or 300 micrograms/kilogram (Hg/kg) of biotin. The table gives the average biotin intake (x) in micrograms per day and the average weight gain (y) in grams per day. Added Biotin Biotin Intake, x Weight Gain, y 0 0.13 8.0 50 2.00 17.1 100 6.05 22.4 150 6.33 24.4 200 7.16 26.5 250 9.66 23.5 300 12.51 23.4 In the MINITAB printout, the second-order polynomial model E(y) = Bo + Bix + B2x2 is fitted to the data. Use the printout to answer the questions. (Use the exact values found in the MINITAB output.) Regression Analysis: y versus x, x-sq Analysis of Variance Source DF SS MS F-Value P-Value Regression 2 226.66 113.331 35.10 0.003 Residual Error 4 12.92 3.229 Total 6 239.58 Model Summary S R-Sq R-Sq (adj) 1.79689 94.61% 91.91% Coefficients Term Coef SE Coef T-Value P-Value Constant 8.62 1.60 5.38 0.006x 3.816 0.555 6.87 0.002 xsq -0.2157 0.0429 -5.03 0.007 Regression Equation y = 8.62 + 3.816 x - 0.2157 xsq Versus Fits (response is 1;} Residual I: ll} 12 14 '16 15 21] 22 24 2'6 Fitted Value A residual plot titled "Versus Fits (resp0nse is y)" is shown. The horizontal axis is labeled "Fitted value" with values from about 8 to 26. o The vertical axis is labeled "Residual" with values from 2.1 to 2.1. . There are 7 points. . A horizontal line at 0 on the vertical axis spans the width of the plot. . There are 3 points below the line and 4 points above the line. . The approximate locations of the points are as follows. 0 (9.2, 71.1), o (15.2,1.7), o (22.8, 0.8), o (24, 71.4), o (24, 0.3), o (24.8, 1.6), o (25.2, 71.9). Normal Probability Plot (response is y) 99 Percent 4 6 5868838 -3 -2 0 3 Residual A normal probability plot titled "Normal Probability Plot (response is y)" is shown. The horizontal axis is labeled "Residual" with values from about -4 to 4. . The vertical axis is labeled "Percent" with values from 1 to 99. There are 7 points. The points are plotted from left to right in an upward, diagonal direction starting from the bottom left of the plot. The points are between approximately -1.9 and 1.7 on the horizontal axis and between approximately 7 and 93 on the vertical axis. A line with positive slope is imposed onto the plot. The line begins at about (-3.5, 1), goes up and right, then ends at about (3.5, 99). There are 4 points below the line and 3 points above the line. The points tend to be fairly close to the line. (a) What is the fitted least-squares line? (Round all numerical values to two decimal places.) y = (b) Find R2. R2 = % Interpret its value. R2 is the percent of the total variation accounted for by using x and x in the model. R2 is the percent of the y-values that fit the model perfectly. R2 is the percent of the totalresiduals less than 1. R2 is the percent of the total residuals greater than 1. R2 is the percent of the total variation unaccounted for by using x and x in the model. (c) Do the data provide sufficient evidence to conclude that the model contributes significant information for predicting y? Based on the p-value for the x term, the model contributes significant information for the prediction of y at the a = 0.01 significance level. Based on the p-value for the F-test, the model does not contribute significant information for the prediction of y at the a = 0.01 significance level. Based on the p-value for the F-test, the model contributes significant information for the prediction of y at the a = 0.01 significance level. Based on the p-value for the x term, the model does not contribute significant information for the prediction of y at the a =0.01 significance level. Based on the p-value for the constant term, the model contributes significant information for the prediction of y at the a = 0.01 significance level. (d) Find the results of the test of Ho: B2 = 0. Is there sufficient evidence to indicate that the quadratic model provides a better fit to the data than a simple linear model does? Based on the p-value for the x term, the quadratic model does provide a better fit than the simple linear model at the a = 0.01 significance level. Based on the p-value for the x term, the quadratic model does not provide a better fit than the simple linear model at the a = 0.01 significance level. Based on the p-value for the x term, the quadratic model does not provide a better fit than the simple linear model at the a = 0.01 significance level. Based on the p-value for the F-test, the quadratic model does provide a better fit than the simple linear model at the a = 0.01 significance level. Based on the p-value for the x2 term, the quadratic model does provide a better fit than the simple linear model at the a = 0.01 significance level. (e) Do the residual plots indicate that any of the regression assumptions have been violated? Explain. The residual plot is unusual, indicating a violation in the assumption of normality. The normal probability plot is unusual, indicating a violation in the assumption of normality. There are no obvious violations in the assumptions based on the patterns shown in the diagnostic plots. The normal probability plot is unusual, indicating a violation in the assumption of constant variance. The residual plot is unusual, indicating a violation in the assumption of constant variance. 2.[12 Points] MendStatlS 13.R.005. The mercury concentrations in striped dolphins were measured as part of a marine pollution study. This concentration is expected to differ in males and females because the mercury in a female is apparently transferred to her offspring during gestation and nursing. The study involved 28 males between the ages of 0.21 and 39.5 years, and 17 females between the ages of 0.80 and 34.5 years. For the data in the table, x1 = age of the dolphin (in years), X2 = 0 if female 1 if male, and y = mercury concentration (in micro grams/gram) in the liver. y x1 x2 y x1 X: 1.70 0.21 1 480.00 22.50 1 1.72 0.33 1 484.00 24.50 1 8.80 2.00 1 212.00 24.50 1 5.90 2.20 1 398.00 25.50 1 101.00 8.50 1 259.00 26.50 1 85.40 11.50 1 323.00 26.50 1 118.00 11.50 1 320.00 26.50 1 177.00 13.50 1 445.00 26.50 1 178.00 16.50 1 278.00 27.50 1 218.00 16.50 1 286.00 28.50 1 180.00 17.50 1 315.00 29.50 1 264.00 20.50 1 y x1 x2 y x1 x2 249.00 31.501 145.00 17.50 0 403.00 31.50 1 180.00 17.50 0 208.00 36.50 1 174.00 18.50 0 314.00 37.50 1 246.00 19.50 0 318.00 39.501 217.00 21.500 2.50 0.80 0 162.00 21.500 9.35 1.58 0 148.00 25.500 4.01 1.75 0 177.00 25.500 29.80 5.50 0 475.00 32.500 45.30 7.50 0 342.00 34.500 101.00 8.05 0 140.00 11.50 0 (a) Write a second-order model relating y to 161 and X2. Allow for curvature in the relationship between age and mercury concentration, and allow for an interaction between gender and age. If\" y=o+1x1+2x2+4x1m+ rt y = 50 + 183an + 4x1x2 + sxlzxz + 8 r y = 30 + 3m + 32.762 + 4xix2 + 357612162 + S t" y = [30 + lxr + m + gxlz + 34mm + sxrzxz + 8 Use a computer software package to perform the multiple regression analysis. Refer to the printout to answer these questions. 0)) Comment on the t of the model, using relevant statistics from the printout. State the tted prediction model. (Enter 0 as the coefficient for any term not used in the model. Round our answers to two decimal places.) 'E r = + Baa.2 x1 X2 State the F test statistic for the model. (Round your answer to two decimal places.) F =1 State the approximate p-value for the model. p-value 0.100 State the R' value for the model. (Round your answer to three two decimal places.) R2 = 1 Does the model fit well? Yes No (c) What is the prediction equation for predicting the mercury concentration in a female dolphin as a function of her age? (Enter 0 as the coefficient for any term not used in the model. Round your answers to two decimal places.) y = L + x1 + (d) What is the prediction equation for predicting the mercury concentration in a male dolphin as a function of his age? (Enter 0 as the coefficient for any term not used in the model. Round your answers to two decimal places.)=| + l; T , x12 (6) Does the quadratic term in the prediction equation for females contribute significantly to the prediction of the mercury concentration in a female dolphin? State the null and alternate hypotheses. Find the test statistic. (Round your answer to two decimal places.) ,=| Approximate the p-value for the test. r p-Value 0.100 State your conclusion. r. H0 is not rejected. The quadratic term is important in predicting mercury concentration for female dolphins. r' H0 is not rejected. The quadratic term is not important in predicting . . f" . . . . mercury concentration for female dolphins. Ho 18 rejected. The quadratic term is not important in predicting mercury concentration for female dolphins. r H0 is rejected. The quadratic term is important in predicting mercury concentration for female dolphins. (1) Are there any other important conclusions that you feel were not considered regarding the tted prediction equation? 3. [12 Points] MendStatlS 13.R.006. The quantitative reasoning scores on the Graduate Record Examination (GRE) were recorded for students admitted to three different graduate programs at a local university. These data were analyzed in Chapter 11 using the analysis of variance for a completely randomized design. Graduate Program Life Sciences Physical Sciences Social Sciences 640 650 670 750 450 530 630 650 650 660 340 460 480 470 710 710 680 560 590 640 700 720 580 540 590 700 540 460 600 640 (a) Write the theoretical model relating the GRE score to the qualitative variable "graduate program" using two dummy (indicator) variables to represent the three graduate programs. (Let y = score, x1 = 1, if Physical Sciences; 0 otherwise, and x2 = 1, if Social Sciences; 0 otherwise.) (II. y = 30 +31x1+ Bzxrxz r' y = [5'0 + 3m + 'mzxzz It" y = [30 +31X1 + 322162 If\" y = 30 + B1131 + 22x1x2 r. y = o+m + zxz (b) Use a computer package to analyze the data with a multiple regression analysis. Is there sufcient evidence to indicate a difference in the average scores between the students who have been admitted to the three graduate programs? Use a = 0.05. State the null and alternative hypotheses. 9.10 How much training time does it take to become a world-class breaststroke swimmer? A survey reported the number of meters per week swum by two groups of swimmersthose who competed only in breaststroke and those who competed in the individual medley (which includes breaststroke). The number of meters per week practicing the breaststroke swim was recorded and the summary statistics are shown here. Breaststroke Individual Medley Sample Size 130 80 Sample Mean 9,016 5,853 Sample Standard Deviation 7,162 1,960 How much longer do pure breaststroke swimmers practice that stroke than individual medley swimmers? (Round your answers to the nearest whole number! Pure breaststroke swimmers swim, on average, between and I more meters per week than individual medley swimmers. What is the practical reason for this difference? I" iPure breaststroke swimmers know how difcult their stroke is and practice. in Swimmers in the individual medley have other strokes to practice. LiPure breaststroke swimmers are more likely to practice than other swimmers. in Swimmers in the individual medley have teammates so they don't need to practice as much. You may need to use the appropriate appendix table or technology to answer this
Step by Step Solution
There are 3 Steps involved in it

Get step-by-step solutions from verified subject matter experts