

Question: Part a. Use the area below to draw a scatter diagram. Speed 3.5 3.5 3.8 3.7 Brokerage Scottrade, Inc. Charles Schwab Fidelity Brokerage Services TD
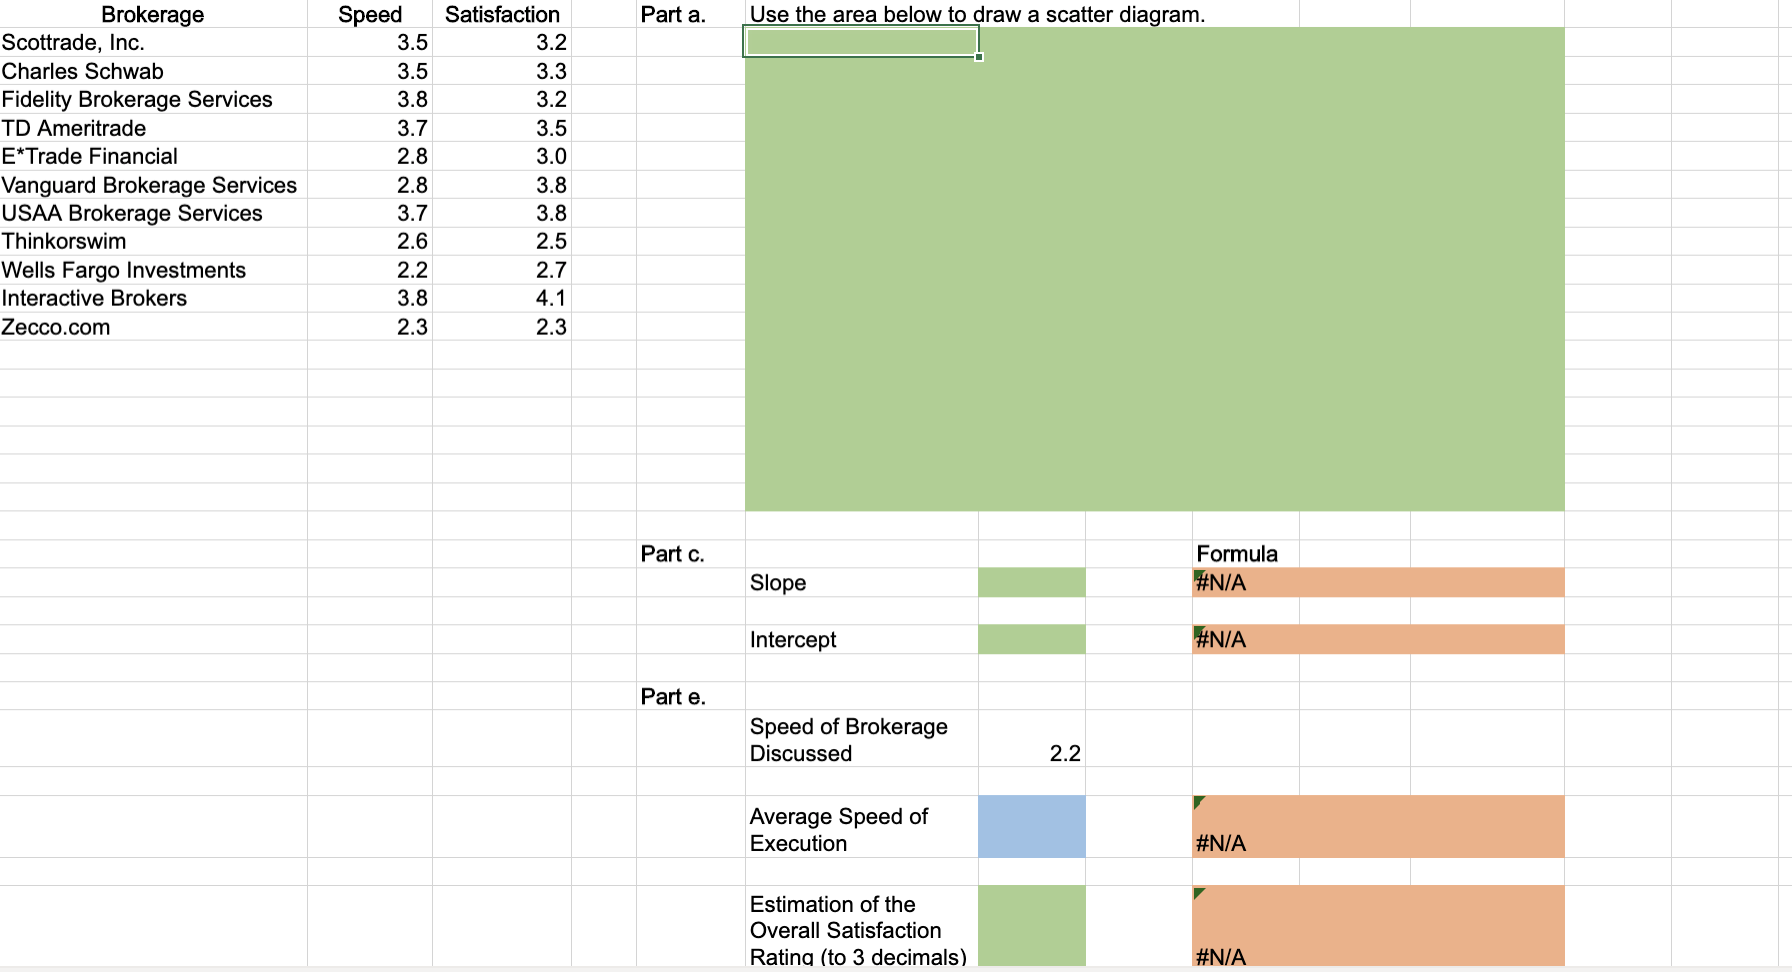
Part a. Use the area below to draw a scatter diagram. Speed 3.5 3.5 3.8 3.7 Brokerage Scottrade, Inc. Charles Schwab Fidelity Brokerage Services TD Ameritrade E*Trade Financial Vanguard Brokerage Services USAA Brokerage Services Thinkorswim Wells Fargo Investments Interactive Brokers Zecco.com 2.8 2.8 3.7 2.6 2.2 3.8 2.3 Satisfaction 3.2 3.3 3.2 3.5 3.0 3.8 3.8 2.5 2.7 4.1 2.3 Part c. Formula #N/A Slope Intercept #N/A Part e. Speed of Brokerage Discussed 2.2 Average Speed of Execution #N/A Estimation of the Overall Satisfaction Rating (to 3 decimals) #N/A Part a. Use the area below to draw a scatter diagram. Speed 3.5 3.5 3.8 3.7 Brokerage Scottrade, Inc. Charles Schwab Fidelity Brokerage Services TD Ameritrade E*Trade Financial Vanguard Brokerage Services USAA Brokerage Services Thinkorswim Wells Fargo Investments Interactive Brokers Zecco.com 2.8 2.8 3.7 2.6 2.2 3.8 2.3 Satisfaction 3.2 3.3 3.2 3.5 3.0 3.8 3.8 2.5 2.7 4.1 2.3 Part c. Formula #N/A Slope Intercept #N/A Part e. Speed of Brokerage Discussed 2.2 Average Speed of Execution #N/A Estimation of the Overall Satisfaction Rating (to 3 decimals) #N/A
Step by Step Solution
There are 3 Steps involved in it

Get step-by-step solutions from verified subject matter experts