

Question: The following questions refer to the diagram below. (Assume a given state of technology and a given total of resources.) Guns (000s) 00 Butter
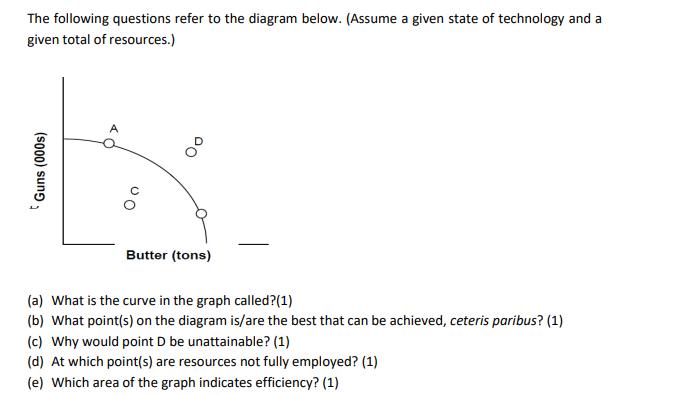
The following questions refer to the diagram below. (Assume a given state of technology and a given total of resources.) Guns (000s) 00 Butter (tons) (a) What is the curve in the graph called? (1) (b) What point(s) on the diagram is/are the best that can be achieved, ceteris paribus? (1) (c) Why would point D be unattainable? (1) (d) At which point(s) are resources not fully employed? (1) (e) Which area of the graph indicates efficiency? (1)
Step by Step Solution
3.52 Rating (162 Votes )
There are 3 Steps involved in it
Ans 1 The curve is known as the production possibility cur... View full answer

Get step-by-step solutions from verified subject matter experts