

Question: Part A. Your first task is to calculate the Slope for the Linear Regression line based on the above data. What is the value of
Part A. Your first task is to calculate the Slope for the Linear Regression line based on the above data. What is the value of the Slope given the past data? If your answer is not an integer, provide at least three decimal places, e.g., 7.500.
Part B. Your second task is to calculate the Intercept for the Linear Regression line based on the above data. What is the value of the Intercept given the past data? If your answer is not an integer, provide at least three decimal places, e.g., 7.500.
Part C. Based on the slope, intercept, and the given data, what is the Average Seasonal Index for the Summer season? You DO NOT need to calculate the average SI for the other seasons. If your answer is not an integer, provide at least three decimal places, e.g., 7.500.
Part D. What is your final demand forecast for Summer 2022 (Period 9)? You need to calculate the regression output for this period and then adjust for seasonality using the average SI. If your answer is not an integer, provide at least three decimal places, e.g., 7.500.
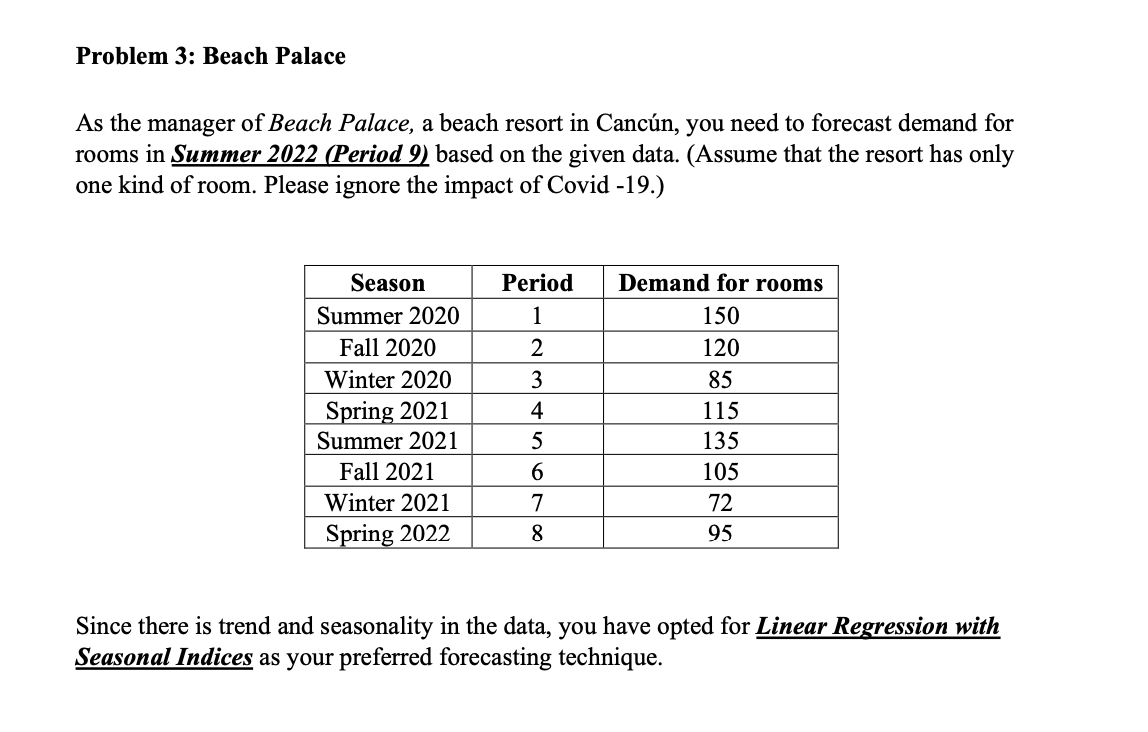
Problem 3: Beach Palace As the manager of Beach Palace, a beach resort in Cancn, you need to forecast demand for rooms in Summer 2022 (Period 9) based on the given data. (Assume that the resort has only one kind of room. Please ignore the impact of Covid -19.) Period 1 2 Season Summer 2020 Fall 2020 Winter 2020 Spring 2021 Summer 2021 Fall 2021 Winter 2021 Spring 2022 3 4 5 6 Demand for rooms 150 120 85 115 135 105 72 95 7 8 Since there is trend and seasonality in the data, you have opted for Linear Regression with Seasonal Indices as your preferred forecasting techniqueStep by Step Solution
There are 3 Steps involved in it

Get step-by-step solutions from verified subject matter experts