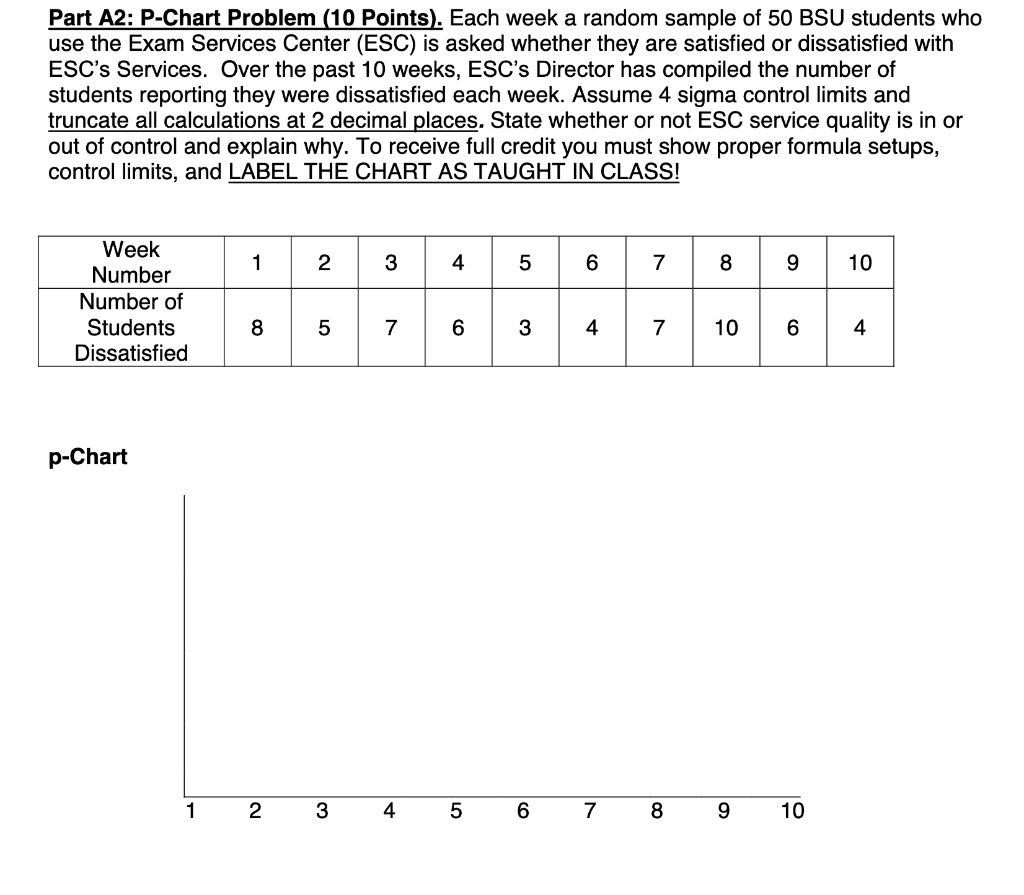
Question: Part A2: P-Chart Problem (10 Points). Each week a random sample of 50 BSU students who use the Exam Services Center (ESC) is asked whether

Part A2: P-Chart Problem (10 Points). Each week a

Part A2: P-Chart Problem (10 Points). Each week a random sample of 50 BSU students who use the Exam Services Center (ESC) is asked whether they are satisfied or dissatisfied with ESC's Services. Over the past 10 weeks, ESC's Director has compiled the number of students reporting they were dissatisfied each week. Assume 4 sigma control limits and truncate all calculations at 2 decimal places. State whether or not ESC service quality is in or out of control and explain why. To receive full credit you must show proper formula setups, control limits, and LABEL THE CHART AS TAUGHT IN CLASS! 1 3 4 5 7 10 Week Number Number of Students Dissatisfied 7 6 4 7 10 4 p-Chart 1 2 3 4 5 6 7 8 9 10

Step by Step Solution

There are 3 Steps involved in it

1 Expert Approved Answer
Step: 1 Unlock blur-text-image
Question Has Been Solved by an Expert!

Get step-by-step solutions from verified subject matter experts

Step: 2 Unlock
Step: 3 Unlock

Students Have Also Explored These Related General Management Questions!