

Question: PART B Data collected on the yearly registrations for a Six Sigma seminar at the Quality College are shown in the following table: a) Calculate
 PART B
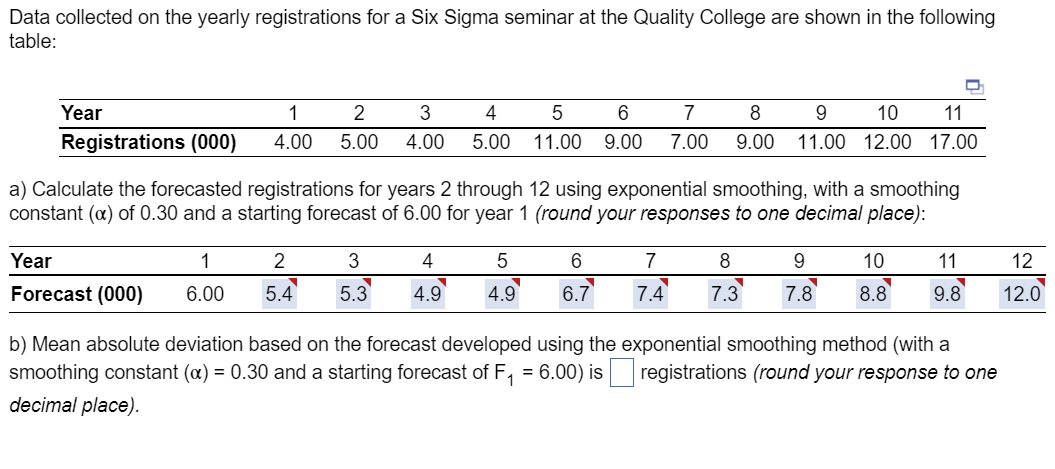
Data collected on the yearly registrations for a Six Sigma seminar at the Quality College are shown in the following table: a) Calculate the forecasted registrations for years 2 through 12 using exponential smoothing, with a smoothing constant () of 0.30 and a starting forecast of 6.00 for year 1 (round your responses to one decimal place): b) Mean absolute deviation based on the forecast developed using the exponential smoothing method (with a smoothing constant ()=0.30 and a starting forecast of F1=6.00 ) is registrations (round your response to one decimal place)
Step by Step Solution
There are 3 Steps involved in it
1 Expert Approved Answer
Step: 1 Unlock

Question Has Been Solved by an Expert!
Get step-by-step solutions from verified subject matter experts
Step: 2 Unlock
Step: 3 Unlock