

Question: Data collected on the yearly registrations for a Six Sigma seminar at the Quality College are shown in the following table: 12345 6 7 8
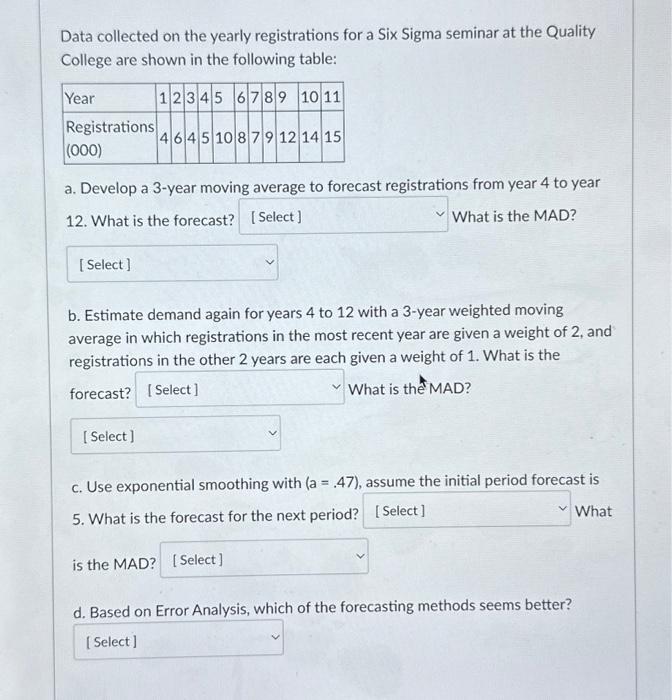
Data collected on the yearly registrations for a Six Sigma seminar at the Quality College are shown in the following table: a. Develop a 3-year moving average to forecast registrations from year 4 to year 12. What is the forecast? What is the MAD? b. Estimate demand again for years 4 to 12 with a 3 -year weighted moving average in which registrations in the most recent year are given a weight of 2 , and registrations in the other 2 years are each given a weight of 1 . What is the forecast? What is the MAD ? c. Use exponential smoothing with (a=.47), assume the initial period forecast is 5. What is the forecast for the next period? What is the MAD? d. Based on Error Analysis, which of the forecasting methods seems better
Step by Step Solution
There are 3 Steps involved in it

Get step-by-step solutions from verified subject matter experts