

Question: Part C (8 points). Write a function called graph_errors(x_vals, start_term, end_term) such that: x_vals is a list of x values for which we compute cos(x)
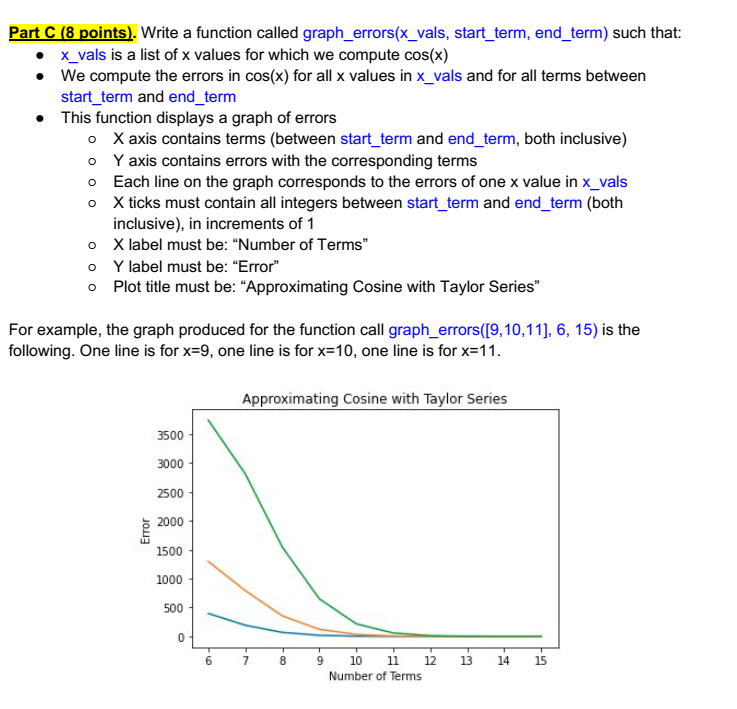
Part C (8 points). Write a function called graph_errors(x_vals, start_term, end_term) such that: x_vals is a list of x values for which we compute cos(x) We compute the errors in cos(x) for all x values in x_vals and for all terms between start_term and end_term This function displays a graph of errors o X axis contains terms (between start_term and end_term, both inclusive) O Y axis contains errors with the corresponding terms Each line on the graph corresponds to the errors of one x value in x_vals o X ticks must contain all integers between start_term and end_term (both inclusive), in increments of 1 o X label must be: "Number of Terms" o Y label must be: Error" o Plot title must be: Approximating Cosine with Taylor Series" o For example, the graph produced for the function call graph_errors([9,10,11], 6, 15) is the following. One line is for x=9, one line is for x=10, one line is for x=11. Approximating Cosine with Taylor Series 3500 3000 2500 2000 Error 1500 1000 500 0 ON 7 8 9 13 14 15 10 11 12 Number of Terms
Step by Step Solution
There are 3 Steps involved in it

Get step-by-step solutions from verified subject matter experts