

Question: Part C Examine the residual plot of the data. Does the residual plot indicate that a linear function is the best function to use to
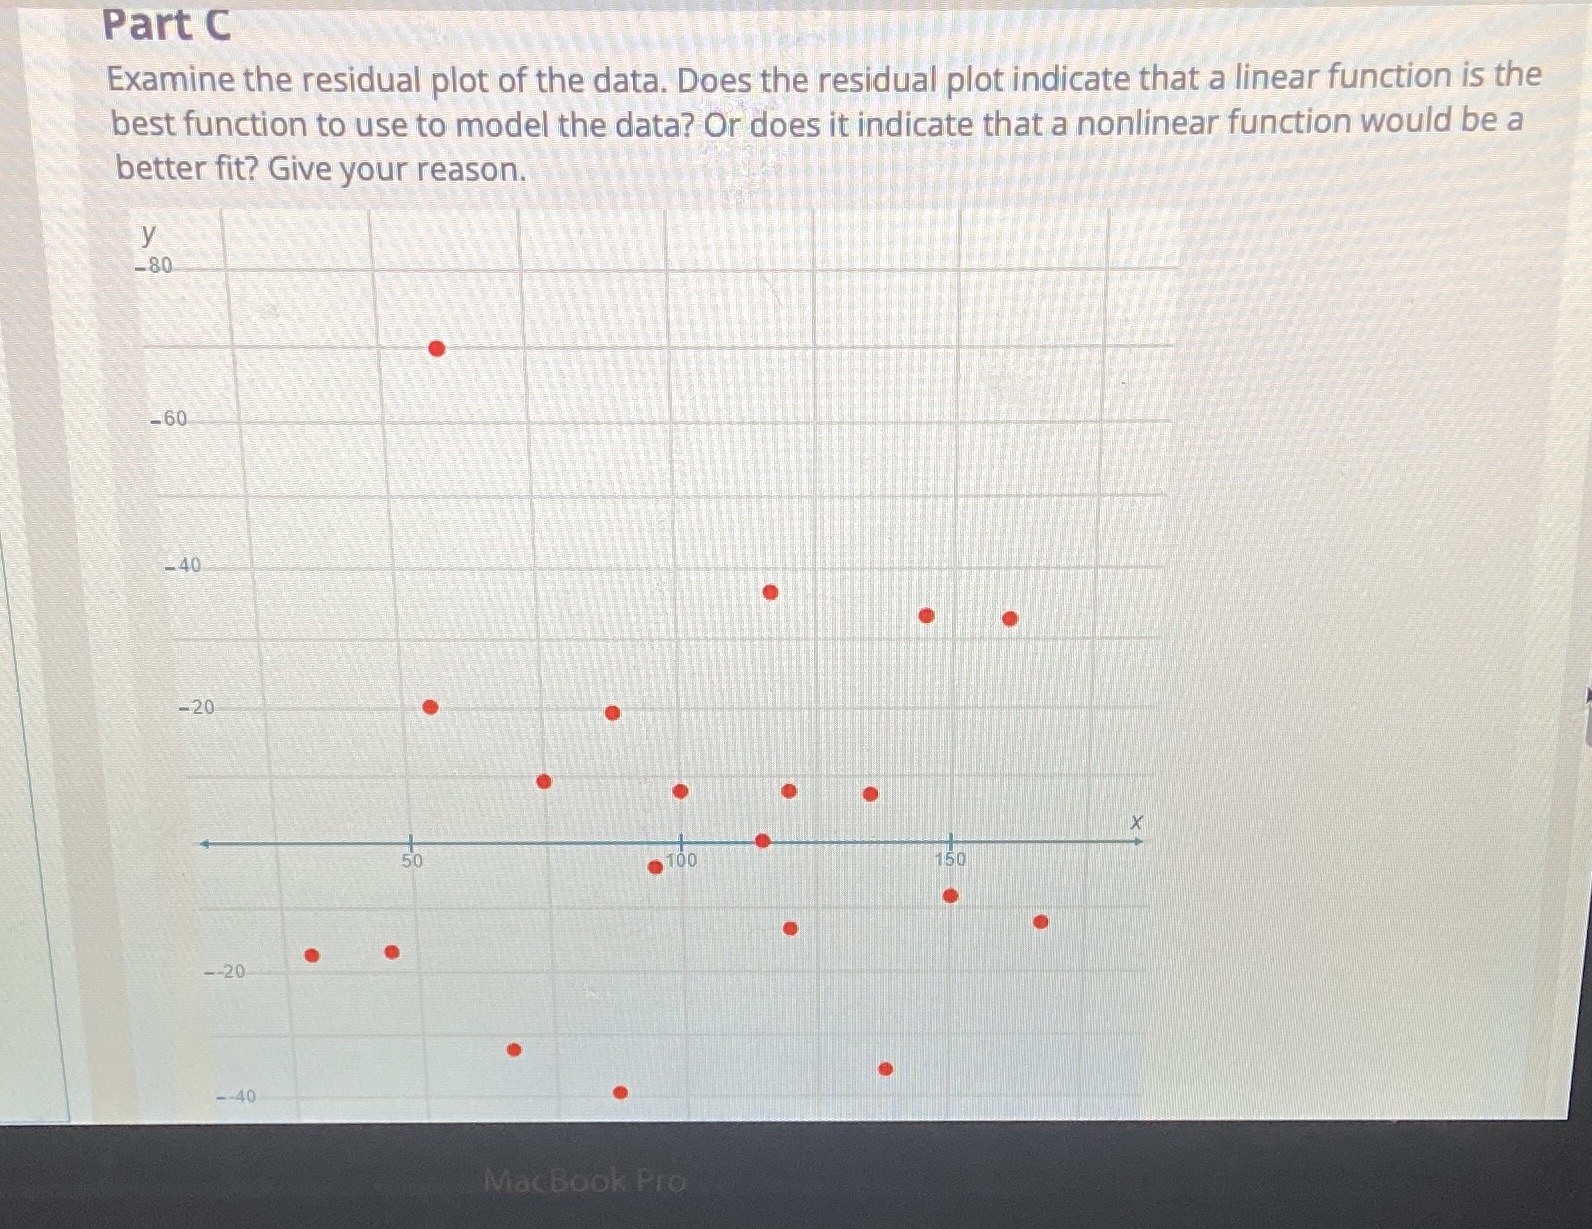
Part C Examine the residual plot of the data. Does the residual plot indicate that a linear function is the best function to use to model the data? Or does it indicate that a nonlinear function would be a better fit? Give your reason. y -80 -60 -40 -20 50 100 150 --20 --40 MacBook Pro
Step by Step Solution
There are 3 Steps involved in it
1 Expert Approved Answer
Step: 1 Unlock

Question Has Been Solved by an Expert!
Get step-by-step solutions from verified subject matter experts
Step: 2 Unlock
Step: 3 Unlock