

Question: part c UCL AND LCL For the r chart please Reter to Table S6.1 - Factors for Computing Control Chat Limits 13 soma) for this

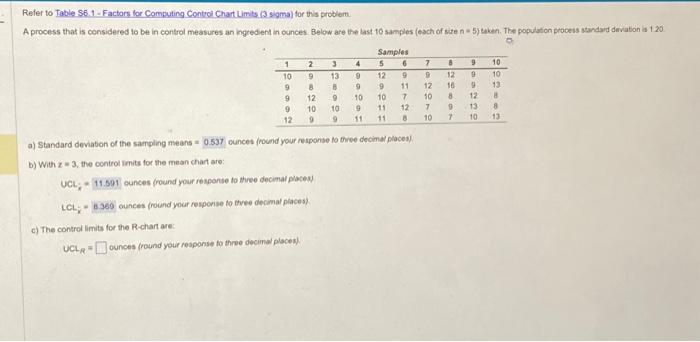
Reter to Table S6.1 - Factors for Computing Control Chat Limits 13 soma) for this problem. A process that is considered to be in control measures an ingredient in ounces. Below are the last 10 samples (esch of site n=55 ) elken. The population process standard diviation a 120 . a) Standard devation of the samping means = 0.537 cuncet (round your resiponse to three decind ploces) b) With z=3, the controi imits for the mean chart are: UCt:nounces(roundyouriesponsetothreedecimalplaces)LCLy=B.segcunces(roundyourresponsetotheedecimalplaces? c) The control limits for the R-chart are: UCLRR=cunces(roundyourresponsetothreedecimalplsces). Reter to Table S6.1 - Factors for Computing Control Chat Limits 13 soma) for this problem. A process that is considered to be in control measures an ingredient in ounces. Below are the last 10 samples (esch of site n=55 ) elken. The population process standard diviation a 120 . a) Standard devation of the samping means = 0.537 cuncet (round your resiponse to three decind ploces) b) With z=3, the controi imits for the mean chart are: UCt:nounces(roundyouriesponsetothreedecimalplaces)LCLy=B.segcunces(roundyourresponsetotheedecimalplaces? c) The control limits for the R-chart are: UCLRR=cunces(roundyourresponsetothreedecimalplsces).
Step by Step Solution
There are 3 Steps involved in it

Get step-by-step solutions from verified subject matter experts