

Question: Answer all parts correct and complete or don't attempt please. Refer to Table S6.1 - Factors for Computing Control Chart Limits (3 s gma) for
Answer all parts correct and complete or don't attempt please.
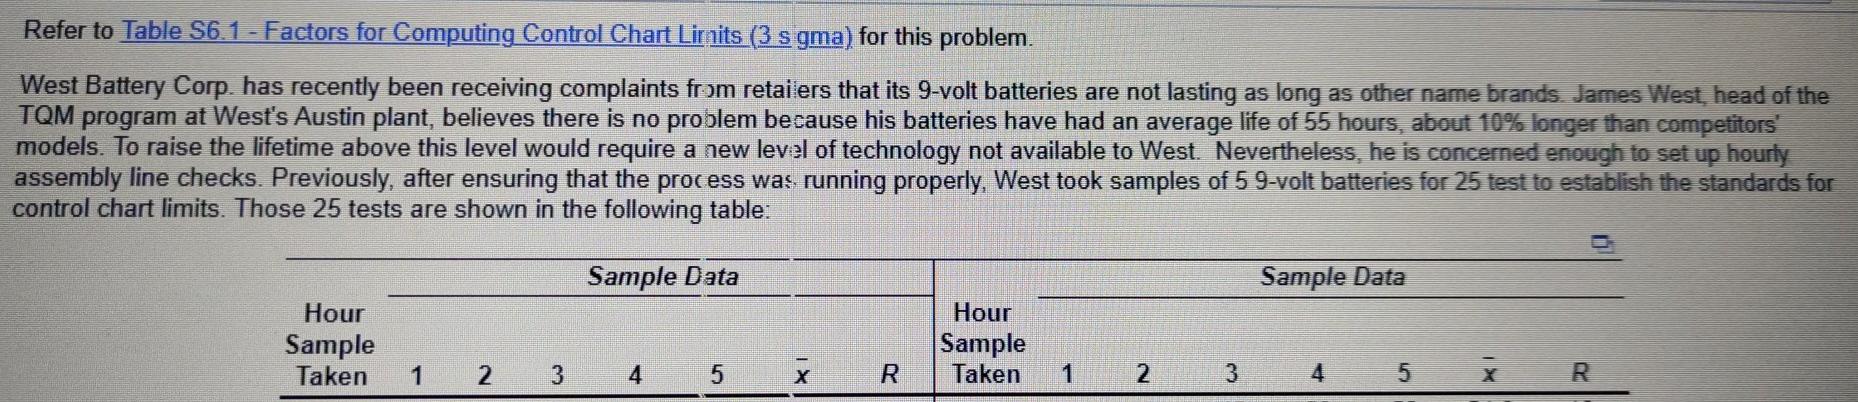
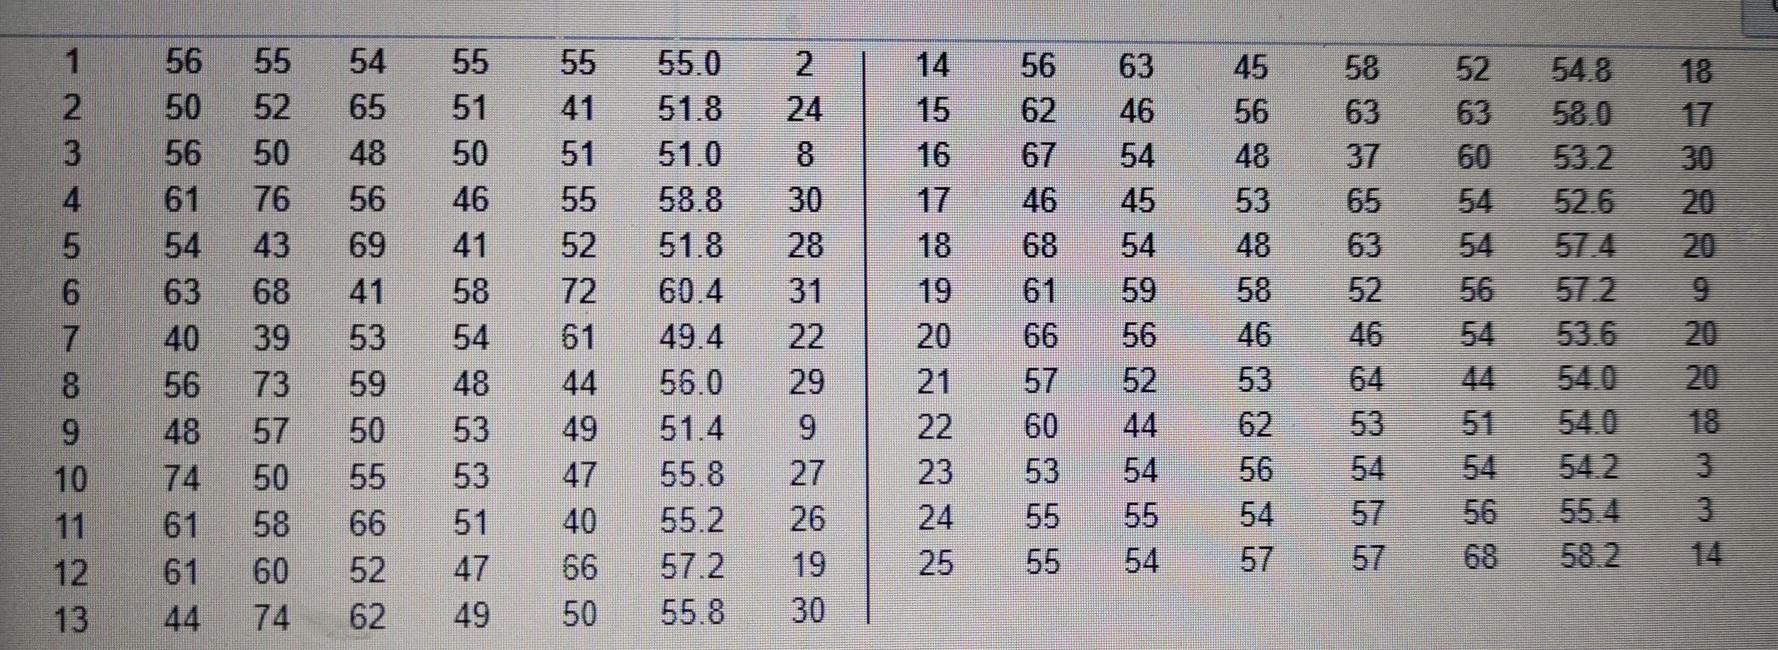
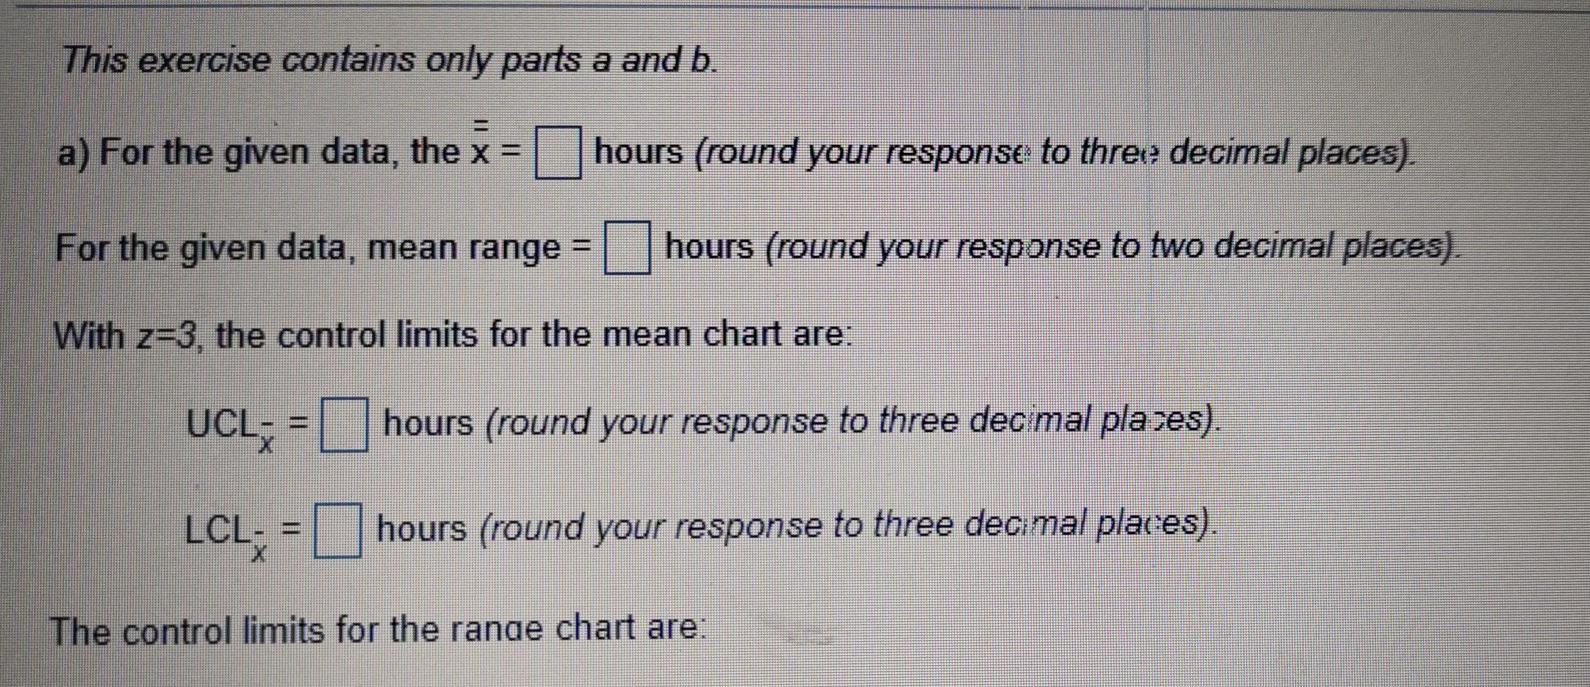
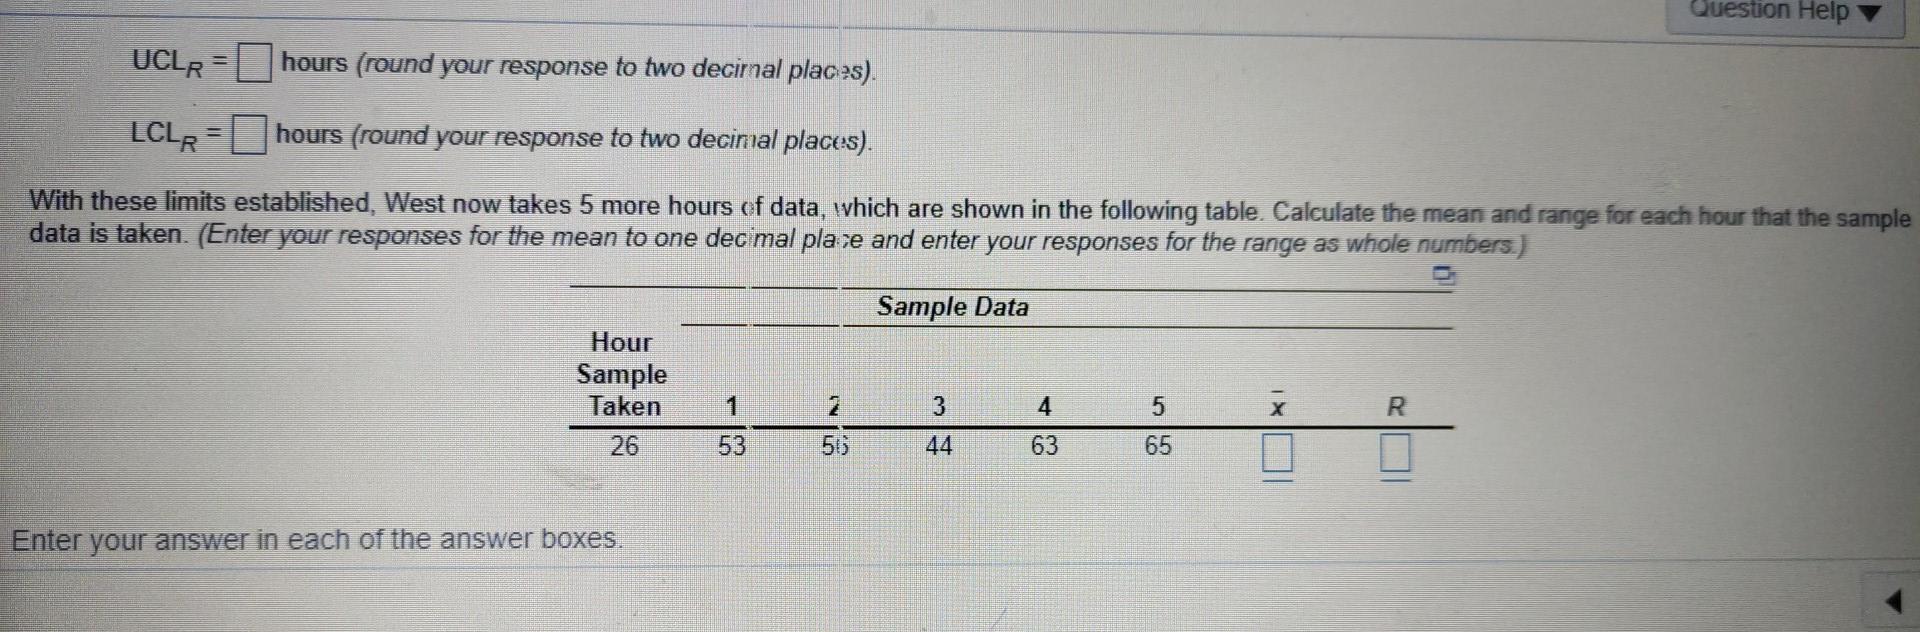
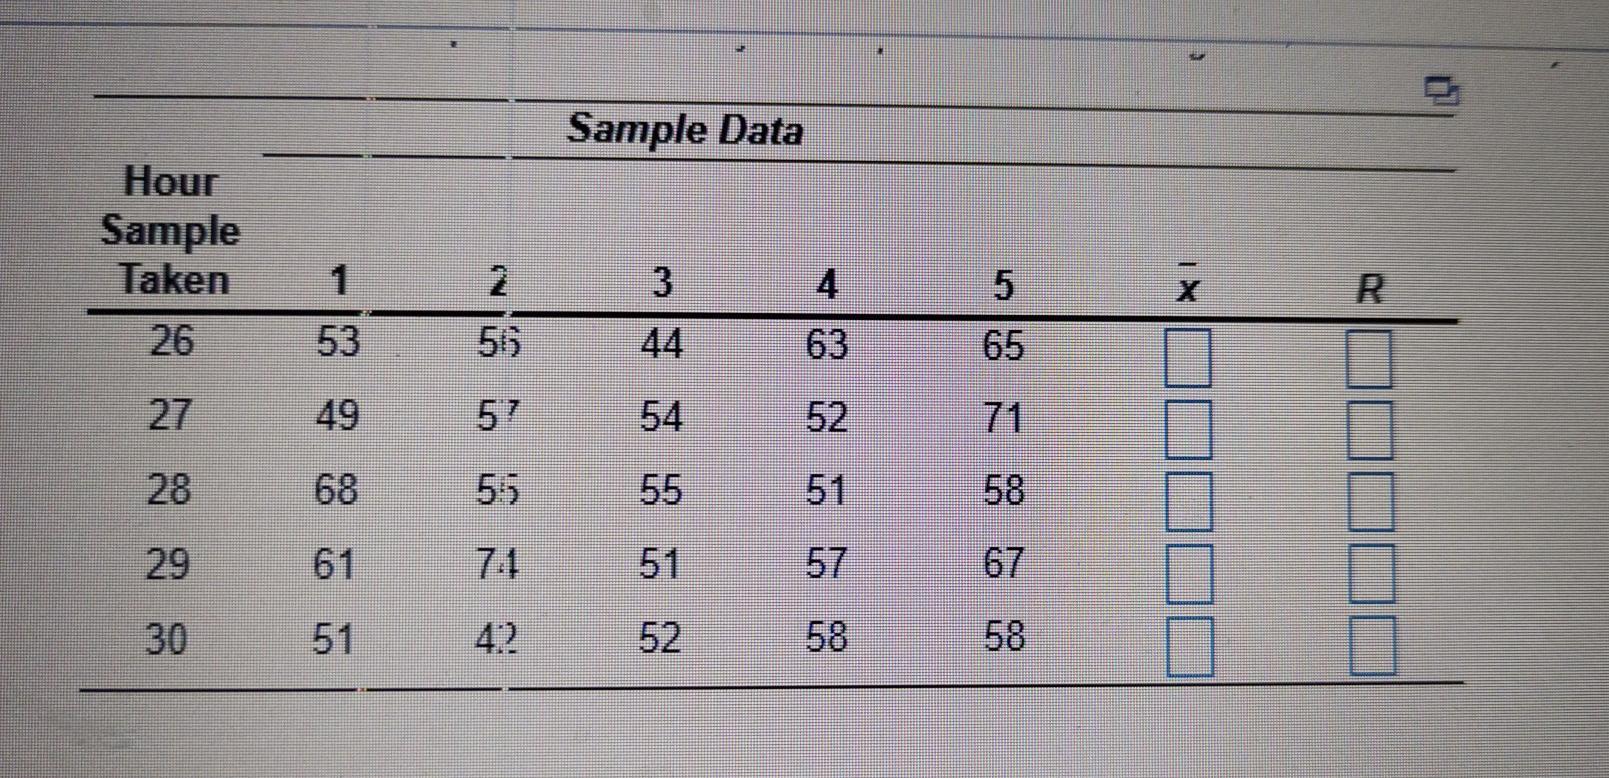
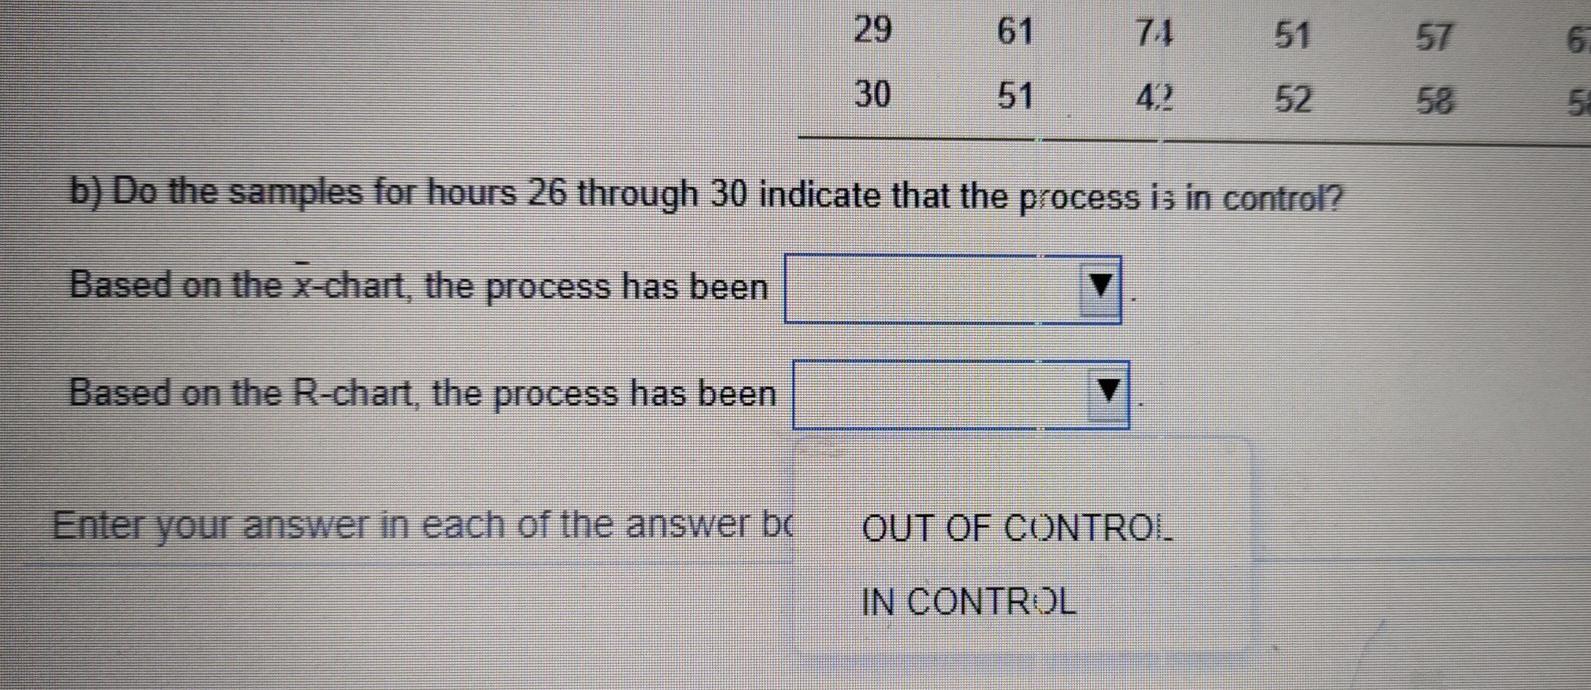
Refer to Table S6.1 - Factors for Computing Control Chart Limits (3 s gma) for this problem. West Battery Corp. has recently been receiving complaints from retailers that its 9-volt batteries are not lasting as long as other name brands. James West, head of the TQM program at West's Austin plant, believes there is no problem because his batteries have had an average life of 55 hours, about 10% longer than competitors' models. To raise the lifetime above this level would require a new level of technology not available to West. Nevertheless, he is concerned enough to set up hourly assembly line checks. Previously, after ensuring that the process was running properly, West took samples of 5 9-volt batteries for 25 test to establish the standards for control chart limits. Those 25 tests are shown in the following table: Sample Data Sample Data Hour Sample Taken Hour Sample Taken 1 2 3 4 5 x R 1 2 3 5 x R 56 52 18 2 55 51 50 46 14 15 16 58 63 37 65 548 58.0 53.2 52.6 4 56 50 56 61 54 63 40 56 48 55 52 50 76 43 68 39 73 57 50 58 60 74 54 65 48 56 69 41 53 59 50 55 66 52 62 55 41 51 55 52 72 61 44 49 6 7 8 9 55.0 51.8 51.0 58.8 51.8 60.4 49.4 56.0 51.4 55.8 55.2 57.2 55.8 63 46 54 45 54 59 56 52 44 54 54 54 56 54 24 8 30 28 31 22 29 9 27 26 19 30 62 67 46 68 61 66 57 60 53 55 55 57.2 53.6 58 54 48 53 53 51 47 49 45 56 48 53 48 58 46 53 62 56 54 57 18 19 20 21 22 23 24 25 20 46 64 53 54 51 54.0 54.2 55.4 58.2 61 61 44 40 66 50 54 68 This exercise contains only parts a and b. a) For the given data, the x = hours (round your response to three decimal places) . For the given data, mean range = hours (round your response to two decimal places) With z=3, the control limits for the mean chart are: UCL: = hours (round your response to three decimal plases) . LCL: - hours (round your response to three decimal places) . The control limits for the ranae chart are: Question Help UCLR hours (round your response to two decimal places) LCLR hours (round your response to two decimal places). With these limits established, West now takes 5 more hours of data, which are shown in the following table. Calculate the mean and range for each hour that the sample data is taken. (Enter your responses for the mean to one decimal pla ze and enter your responses for the range as whole numbers.) Sample Data Hour Sample Taken 3 4 5 x R 26 53 56 44 63 65 Enter your answer in each of the answer boxes. Sample Data Hour Sample Taken 1 3 5 26 53 65 27 5? 54 28 68 55 42 52 58 58
Step by Step Solution
There are 3 Steps involved in it
1 Expert Approved Answer
Step: 1 Unlock

Question Has Been Solved by an Expert!
Get step-by-step solutions from verified subject matter experts
Step: 2 Unlock
Step: 3 Unlock