

Question: Part C.Find the critical value Using a t-distribution table For the following claim, find the null and alternative hypotheses, test statistic, critical value, and draw
Part C.Find the critical value Using a t-distribution table
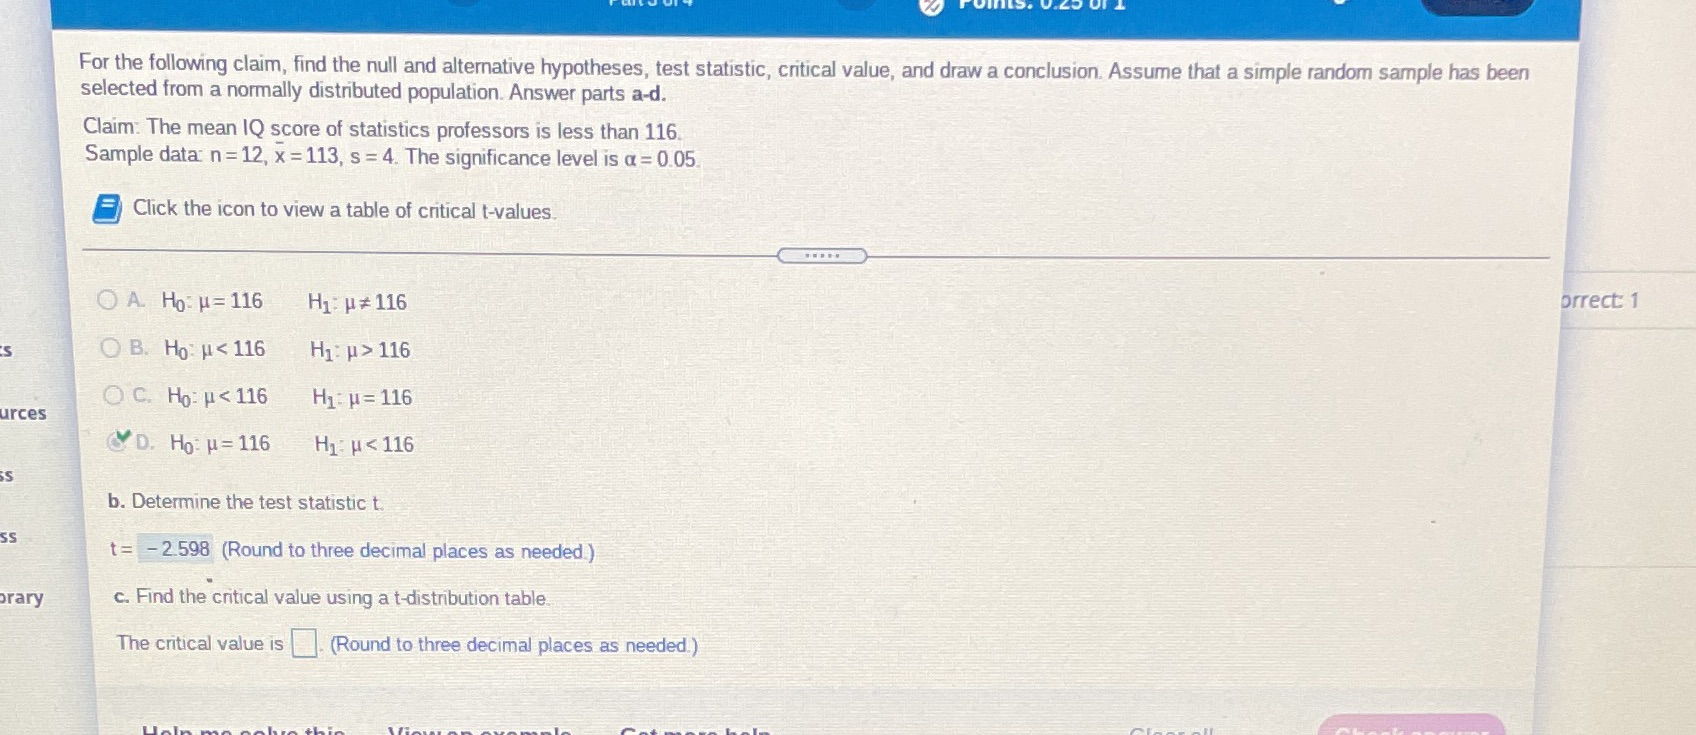
For the following claim, find the null and alternative hypotheses, test statistic, critical value, and draw a conclusion. Assume that a simple random sample has been selected from a normally distributed population. Answer parts a-d. Claim: The mean IQ score of statistics professors is less than 116. Sample data: n =12, x =113, s = 4. The significance level is a = 0.05 Click the icon to view a table of critical t-values. ..... O A. Ho H= 116 H1: p # 116 orrect 1 O B. Ho: H 116 O C. Ho: p
Step by Step Solution
There are 3 Steps involved in it
1 Expert Approved Answer
Step: 1 Unlock

Question Has Been Solved by an Expert!
Get step-by-step solutions from verified subject matter experts
Step: 2 Unlock
Step: 3 Unlock