

Question: Part I Complete Linear Regression Model Analysis (60%) A study in Computers and Electronics in Agriculture (Vol. 174, 2020) provides a method for obtaining uniform
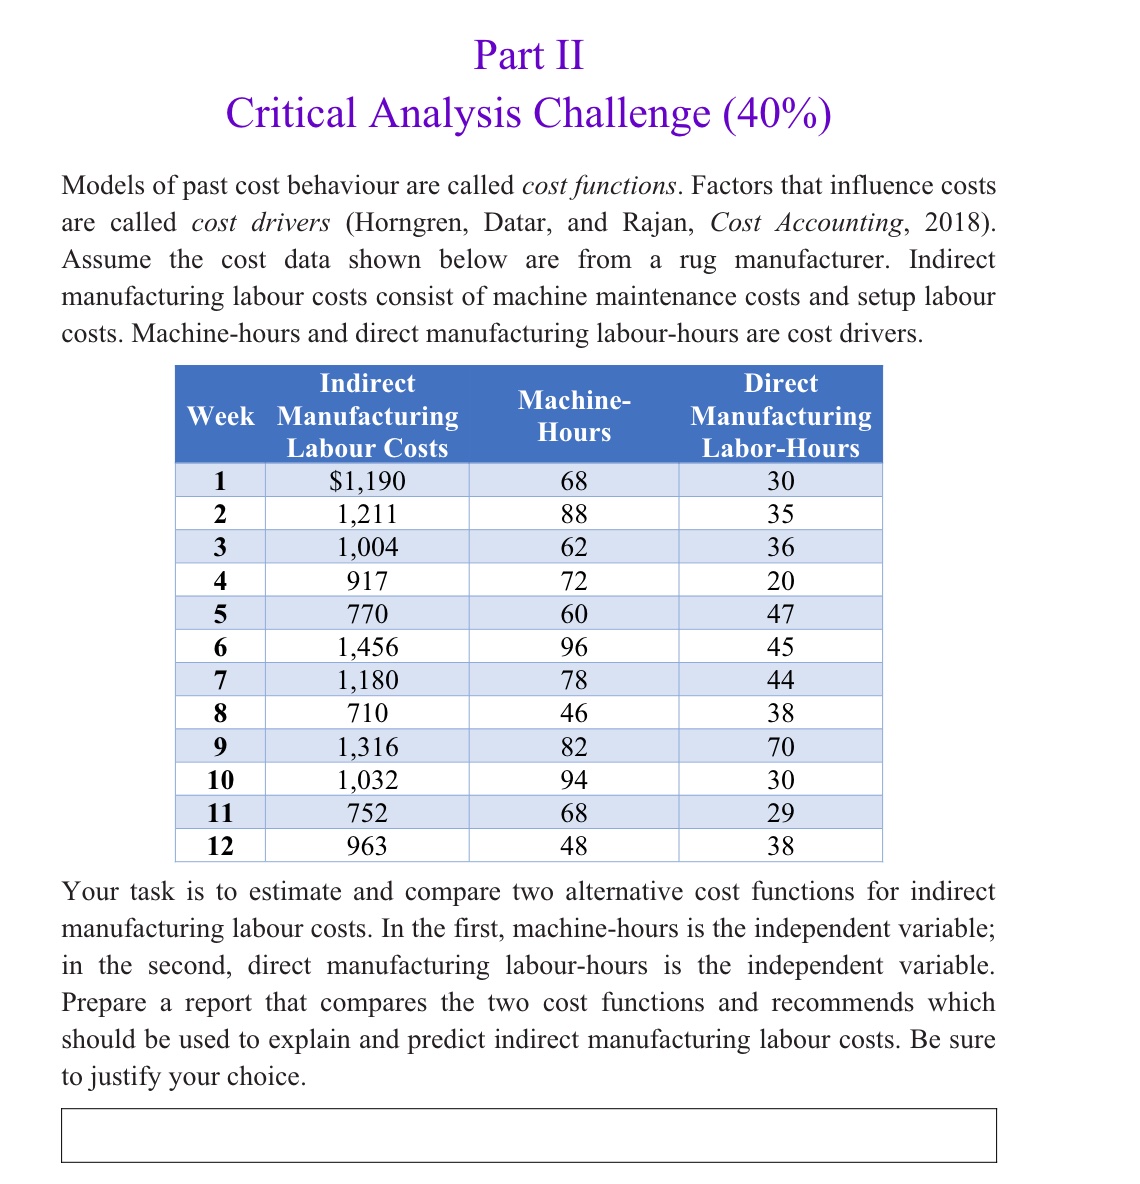
Part I Complete Linear Regression Model Analysis (60%) A study in Computers and Electronics in Agriculture (Vol. 174, 2020) provides a method for obtaining uniform seed varieties from crop production. A computer vision system was developed to distinguish seven different registered varieties of dry beans with similar features in order to obtain uniform seed classication. Images of 13,611 grains of the seven beans were taken with a high-resolution camera for the classication model. The images obtained using the computer vision system were subjected to segmentation and feature extraction stages, and a total of 16 features, 12 dimensions, and 4 shape forms were obtained from the grains. Here, you are going to analyze the relationship between the major axis length (y) (in pixels), and the minor axis length (x) (in pixels) of the beans, in which y is the distance between the ends of the longest line that can be drawn from a bean and x is the longest line that can be drawn from the bean while stationed perpendicular to the main axis. The data are saved in a file named "BeanDataset.csv" accompanied by this project on the Blackboard. You have to conduct a complete simple linear regression analysis of the data. Summarize your ndings in a professional report. (Hint: See the Complete example in the slides.) % Part II Critical Analysis Challenge (40%) Models of past cost behaviour are called castmcn'ons. Factors that inuence costs are called cost drivers (Horngren, Datar, and Rajan, Cost Accounting, 2018). Assume the cost data shown below are from a rug manufacturer. Indirect manufacturing labour costs consist of machine maintenance costs and setup labour costs. Machine-hours and direct manufacturing labour-hours are cost drivers. Indirect Machine Direct W'eek Manufacturing Hours Manufacturing Labour Costs Labor-Hours 1 $1,190 68 30 2 1,211 _ 88 _ 35 3 1,004 62 36 4 917 72 20 5 770 _ 60 47 6 1,456 96 _ 45 7 1,180 _ 78 44 8 710 46 38 9 _ 1,316 82 70 10 _ 1,032 94 _ 30 11 _ 752 68 29 12 963 48 38 Your task is to estimate and compare two alternative cost functions for indirect manufacturing labour costs. In the rst, machine-hours is the independent variable; in the second, direct manufacturing labour-hours is the independent variable. Prepare a report that compares the two cost functions and recommends which should be used to explain and predict indirect manufacturing labour costs. Be sure to justify your choice
Step by Step Solution
There are 3 Steps involved in it
To complete the tasks provided we will address both parts of the project in a comprehensive manner Part I Complete Linear Regression Model Analysis Ob... View full answer

Get step-by-step solutions from verified subject matter experts