

Question: Part I: Demand and Supply Curves Table 4.1 represents supply and demand for a piece of medical equipment. On the same graph, show the demand
Part I: Demand and Supply Curves
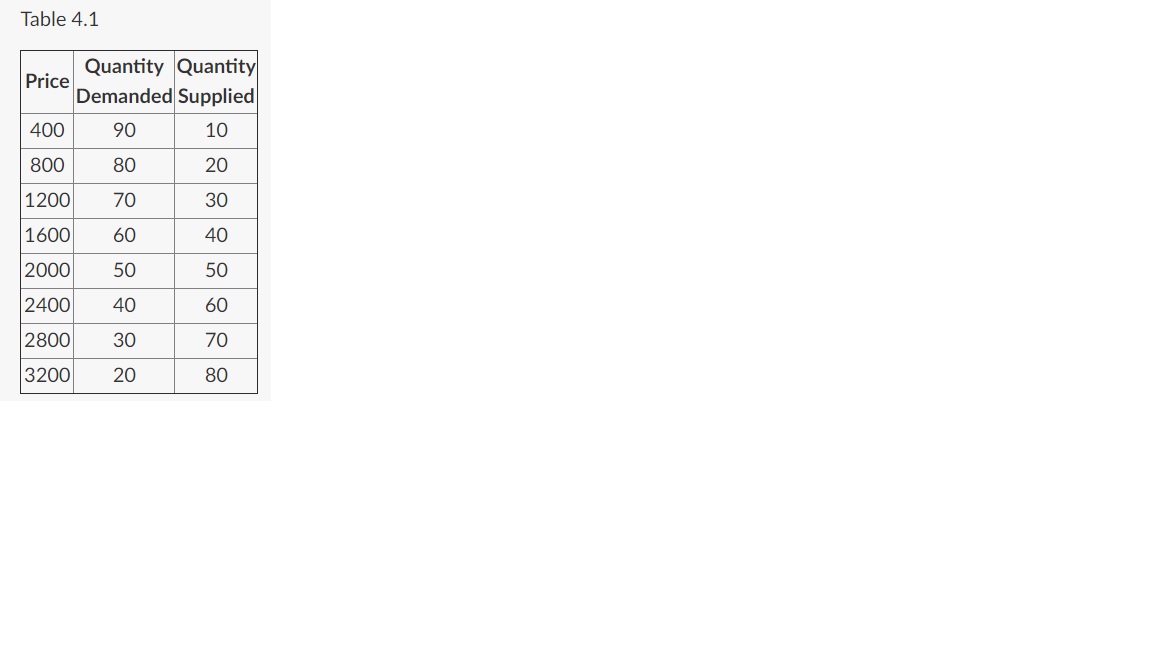
Table 4.1 represents supply and demand for a piece of medical equipment.
- On the same graph, show the demand curve and supply curve for this piece of medical equipment.
- Identify where the market equilibrium is on the graph.
- State the Peand Qefor this piece of medical equipment.
Part II: Changing Peand Qe
For this part of the assignment, you do not use the numbers provided for Part I.
For each of the following situations, make a graph of equilibrium in a market. Then, graphically show how each curve will shift. Indicate the direction in which each shift will occur. Finally, show how the Peand Qeare affected by each situation.
- A good is a normal good and income increases.
- Consumers expect the price of a good to be lower in the future.
- There is a decrease in resource prices.
- There is a decrease in the number of existing suppliers.
Step by Step Solution
There are 3 Steps involved in it
1 Expert Approved Answer
Step: 1 Unlock

Question Has Been Solved by an Expert!
Get step-by-step solutions from verified subject matter experts
Step: 2 Unlock
Step: 3 Unlock