

Question: Part II . Create a chart to show intervals on which the function is increasing / decreasing and on which the derivative is positive /
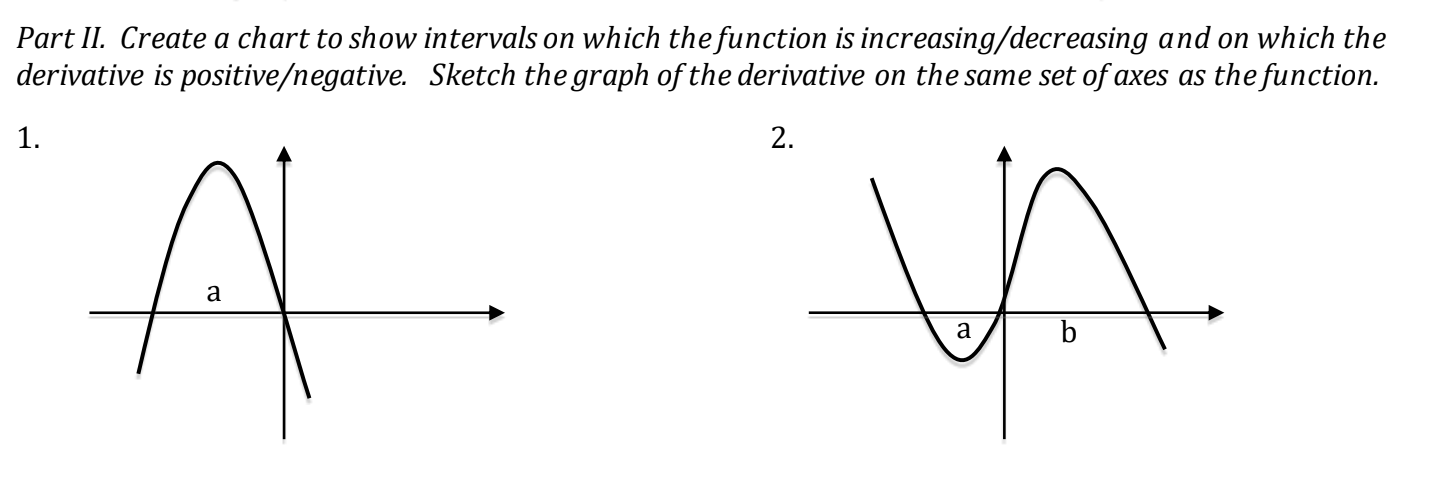
Part II Create a chart to show intervals on which the function is increasingdecreasing and on which the
derivative is positivenegative Sketch the graph of the derivative on the same set of axes as the function.
Step by Step Solution
There are 3 Steps involved in it
1 Expert Approved Answer
Step: 1 Unlock

Question Has Been Solved by an Expert!
Get step-by-step solutions from verified subject matter experts
Step: 2 Unlock
Step: 3 Unlock