

Question: Part III : Risk and Return Analysis. This section of the test addresses the risk return analysis. You are asked to invest $100,000 from an
Part III : Risk and Return Analysis. This section of the test addresses the risk return analysis. You are asked to invest $100,000 from an estate for which the bank is trustee. Because the estate is expected to be distributed to the heirs in approximately one year, you have been instructed to plan for a one-year holding period. Furthermore, you are restricted to the following investment alternatives, shown with their probabilities and associated outcomes the Table .
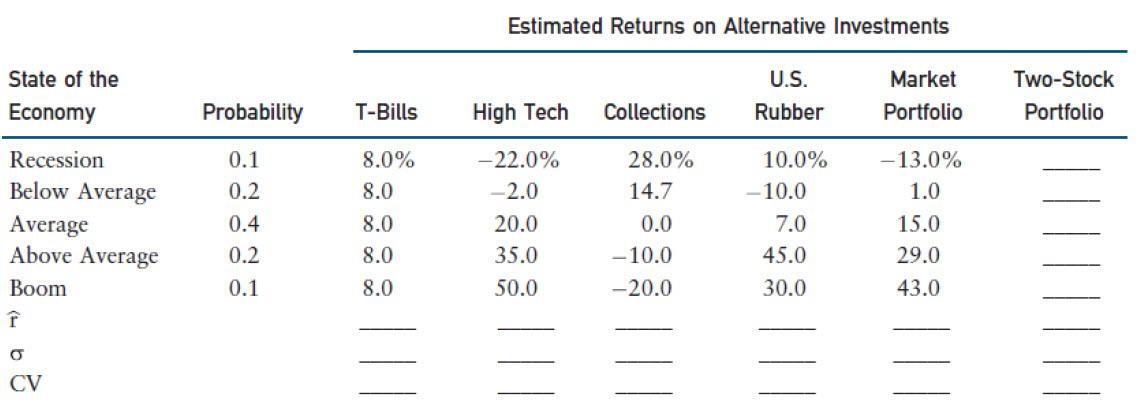 The economic forecasting staff has developed probability estimates for the state of the economy, and the rate of return on each alternative under each state of the economy. See columns 1 and 2 in the Table. The T-bills is risk free rate; High Tech, Inc., is an electronics firm; Collections, Inc., collects past-due debts; and U.S. Rubber manufactures tires and various other rubber and plastic products. The market portfolio is an index fund that includes a market-weighted fraction of all publicly traded stocks; by investing in that fund, you can obtain average stock market results.
C. Suppose you created a two-stock portfolio by investing $50,000 in High Tech and $50,000 in Collections. Calculate the expected return rP , the standard deviation (p), and the coefficient of variation (CVp) for this portfolio and fill in the appropriate rows in the table. How does the riskiness of this two-stock portfolio compare to the riskiness of the individual stocks if they were held in isolation?
Estimated Returns on Alternative Investments State of the Economy U.S. Rubber Market Portfolio Two-Stock Portfolio Probability T-Bills High Tech Collections 8.0% 8.0 28.0% 14.7 Recession Below Average Average Above Average Boom f 0.1 0.2 0.4 0.2 0.1 8.0 8.0 8.0 -22.0% -2.0 20.0 35.0 50.0 0.0 -10.0 -20.0 10.0% - 10.0 7.0 45.0 30.0 -13.0% 1.0 15.0 29.0 43.0 ||| CV Estimated Returns on Alternative Investments State of the Economy U.S. Rubber Market Portfolio Two-Stock Portfolio Probability T-Bills High Tech Collections 8.0% 8.0 28.0% 14.7 Recession Below Average Average Above Average Boom f 0.1 0.2 0.4 0.2 0.1 8.0 8.0 8.0 -22.0% -2.0 20.0 35.0 50.0 0.0 -10.0 -20.0 10.0% - 10.0 7.0 45.0 30.0 -13.0% 1.0 15.0 29.0 43.0 ||| CV
Step by Step Solution
There are 3 Steps involved in it

Get step-by-step solutions from verified subject matter experts