

Question: part one: dash installation (pip install dash, pip install jupyter-dash, pip install pandas) part two: create a file names app.py, copy tbe code below into
# Run this app with `python app.py` and
# visit http://127.0.0.1:8050/ in your web browser.
from dash import Dash, html, dcc
import plotly.express as px
import pandas as pd
app = Dash(__name__)
# assume you have a "long-form" data frame
# see https://plotly.com/python/px-arguments/ for more options
df = pd.DataFrame({
"Fruit": ["Apples", "Oranges", "Bananas", "Apples", "Oranges", "Bananas"],
"Amount": [4, 1, 2, 2, 4, 5],
"City": ["SF", "SF", "SF", "Montreal", "Montreal", "Montreal"]
})
fig = px.bar(df, x="Fruit", y="Amount", color="City", barmode="group")
app.layout = html.Div(children=[
html.H1(children='Hello Dash'),
html.Div(children='''
Dash: A web application framework for your data.
'''),
dcc.Graph(
id='example-graph',
figure=fig
)
])
if __name__ == '__main__':
app.run_server(debug=True)
pt 1,2, and 3 are here https://dash.plotly.com/introduction
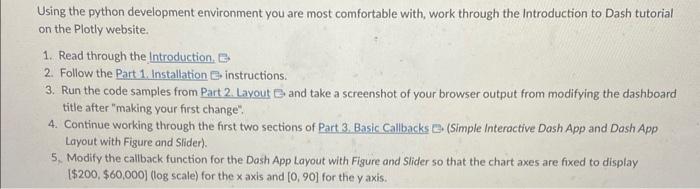
Using the python development environment you are most comfortable with, work through the Introduction to Dash tutorial on the Plotly website. 1. Read through the Introduction. 2. Follow the Part 1. Installation 0 instructions. 3. Run the code samples from Part 2. Layout B and take a screenshot of your browser output from modifying the dashboard title after "making your first change". 4. Continue working through the first two sections of Part 3. Basic Callbacks E. (Simple Interactive Dash App and Dash App Layout with Figure and Slider). 5. Modify the callback function for the Dash App Layout with Figure and Slider so that the chart axes are fixed to display [$200,$60,000] (log scale) for the x axis and [0,90] for the y axis. Using the python development environment you are most comfortable with, work through the Introduction to Dash tutorial on the Plotly website. 1. Read through the Introduction. 2. Follow the Part 1. Installation 0 instructions. 3. Run the code samples from Part 2. Layout B and take a screenshot of your browser output from modifying the dashboard title after "making your first change". 4. Continue working through the first two sections of Part 3. Basic Callbacks E. (Simple Interactive Dash App and Dash App Layout with Figure and Slider). 5. Modify the callback function for the Dash App Layout with Figure and Slider so that the chart axes are fixed to display [$200,$60,000] (log scale) for the x axis and [0,90] for the y axis
Step by Step Solution
There are 3 Steps involved in it

Get step-by-step solutions from verified subject matter experts