

Question: Part Two: Gender Perception in the Workforce Gender perception in the workplace can often be skewed. For example, jobs in STEM can often be overrepresented
Part Two: Gender Perception in the Workforce
Gender perception in the workplace can often be skewed. For example, jobs in STEM can often be overrepresented by men, which can have negative consequences for budding female scientists. But how can we quantify the extent of this gender misperception? This data set is taken from Pew Research Center, which used an algorithm to sample the proportion of women found in images that represent various occupations. They then compared this to the proportion of women who actually work in the field, taken from the Bureau of Labor Statistics (BLS).
Suppose researchers want to show that women are underrepresented by at least 5% in STEM-related jobs at a 95% level of confidence. Our data set then serves as a representative sample of all occupations and would give us a good look into whether women were accurately portrayed in images.
Performing the Test
Step 1: Write the null hypothesis/alternative hypotheses below. Determine the tail type.
have less than or equal to 5% of all students take the SAT,
have more than 5% of all students take the SAT,
: right tail
Step 2: Find the difference between the true proportion of women who work in the field compared to the image search proportion for each occupation (bls_proportion_women) - (image_search_proportion_women).
Step 3: Perform the Hypothesis Test in Excel. Remember that you're working with a proportion, so you'll need to use the according formula. Fill out the cells indicated on the spreadsheet and determine whether to accept/reject the null hypothesis.
Analysis of Results
What is the conclusion of the hypothesis test? Were you able to reject the null hypothesis?
What kinds of fields were women most unrepresented? Most overrepresented? Would these misrepresentations significantly skew your results?
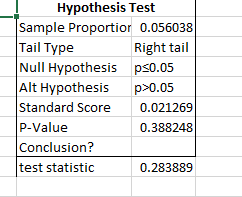
Hypothesis Test Sample Proportion 0.056038 Tail Type Right tail Null Hypothesis PE0.05 Alt Hypothesis p>0.05 Standard Score 0.021269 P-Value 0.388248 Conclusion? test statistic 0.283889
Step by Step Solution
There are 3 Steps involved in it

Get step-by-step solutions from verified subject matter experts