

Question: Part3 - Analysis ofthe acceleration-time graphs(a-t graph) Use the linear part of the acceleration-time graph and using statistics tool in logger pro, find the average
Part3 - Analysis ofthe acceleration-timegraphs(a-t graph)
Use the linear part of theacceleration-timegraph and using statistics tool in logger pro, find the average value of accelerationaand tabulate those values in table 2.
- Analyze theacceleration-timegraphs for all trials and obtain the values of the acceleration for the upward motion. How these values compare with the slope values? Find the % difference between values of column 4 and 5 in table 2.
Table 2-Copy slope data from table 1 and paste in table 2.
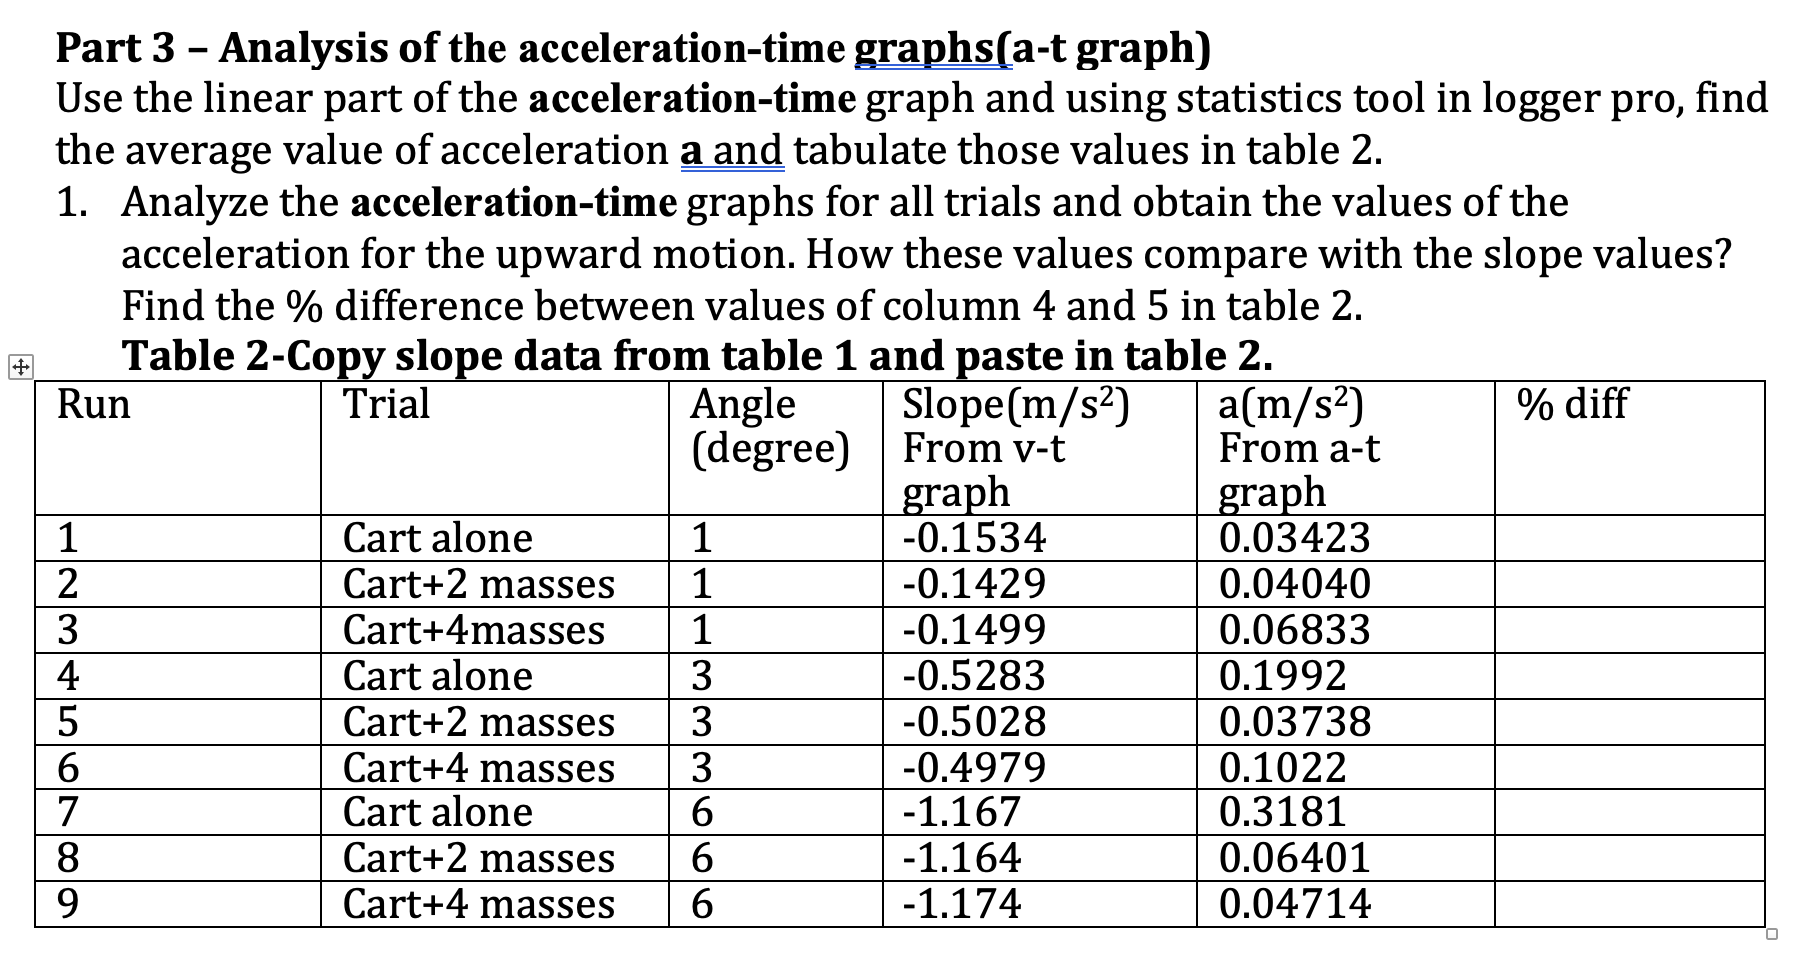
Part 3 - Analysis of the acceleration-time graphs(a-t graph) Use the linear part of the acceleration-time graph and using statistics tool in logger pro, find the average value of acceleration a and tabulate those values in table 2. 1. Analyze the acceleration-time graphs for all trials and obtain the values of the acceleration for the upward motion. How these values compare with the slope values? Find the % difference between values of column 4 and 5 in table 2. Table 2-Copy slope data from table 1 and paste in table 2. Run Trial Angle Slope(m/$2) a(m/s2) % diff (degree) From v-t From a-t graph graph Cart alone 1 -0.1534 0.03423 2 Cart+2 masses 1 -0.1429 0.04040 Cart+4masses -0.1499 0.06833 Cart alone 3 -0.5283 0.1992 Cart+2 masses 3 -0.5028 0.03738 Cart+4 masses 3 -0.4979 0.1022 7 Cart alone 6 -1.167 0.3181 CO Cart+2 masses 6 -1.164 0.06401 9 Cart+4 masses 6 -1.174 0.04714
Step by Step Solution
There are 3 Steps involved in it

Get step-by-step solutions from verified subject matter experts