Question: Parta.) BEEFEATER FORECAST SALES IN WORKERS NEEDED DEUTSCHLANDER AGGREGATE WORKER TO MEET SALES FORECAST FORECAST HOURS AVERAGE = 75 ENDING HIRINGS INVENTORY MONTH LAYOFFS Nov.16
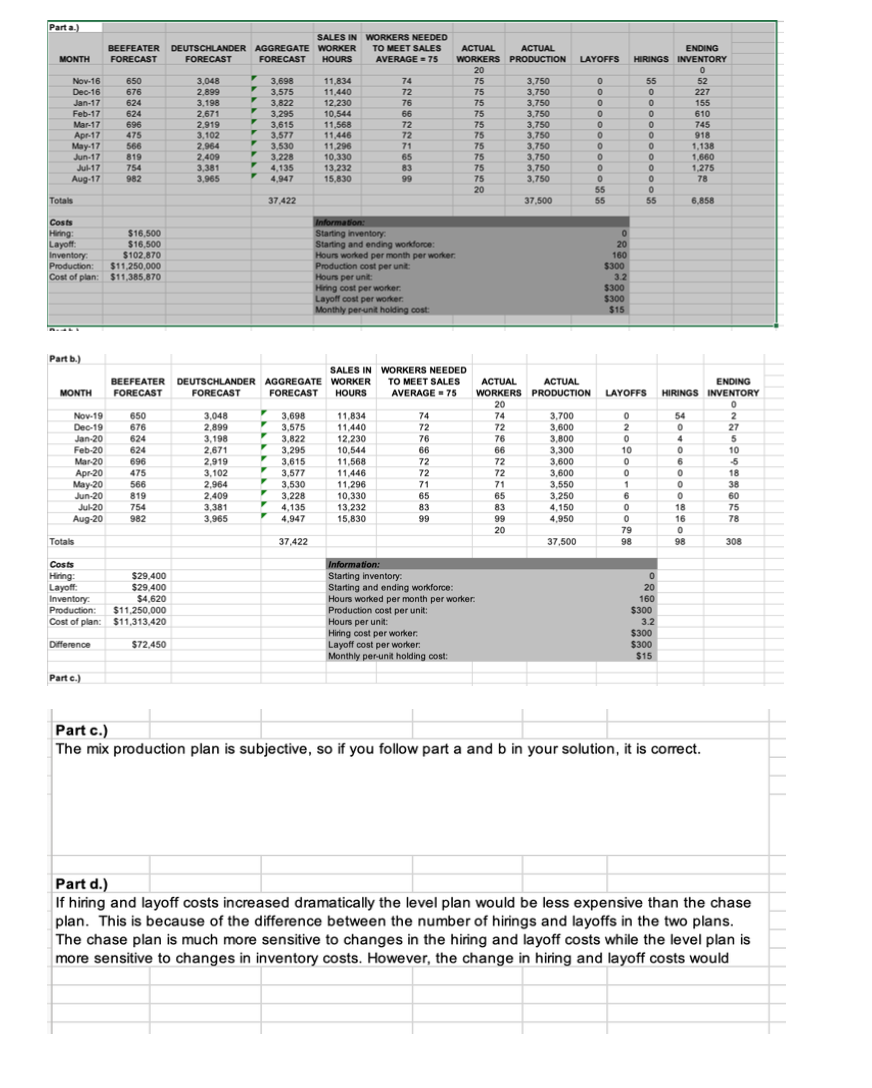
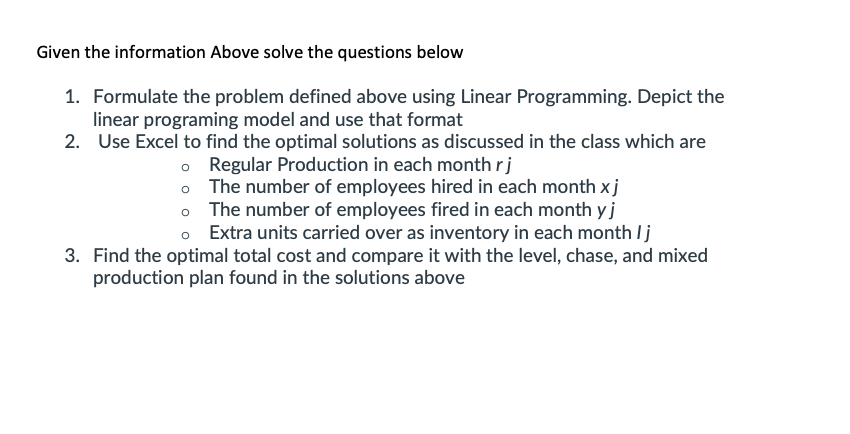
Parta.) BEEFEATER FORECAST SALES IN WORKERS NEEDED DEUTSCHLANDER AGGREGATE WORKER TO MEET SALES FORECAST FORECAST HOURS AVERAGE = 75 ENDING HIRINGS INVENTORY MONTH LAYOFFS Nov.16 Dec-16 Jan-17 Feb-17 Mar-17 Apr17 May-17 Jun-17 Jul 17 Aug.17 650 676 624 624 696 475 566 819 754 982 3,048 2,899 3,198 2,671 2,919 3,102 2,964 2.409 3,381 3,965 3,698 3,575 3,822 3.295 3,615 3,577 3,530 3.228 4,135 4,947 11,834 11,440 12 230 10,544 11,568 11.446 11,296 10,330 13,232 15,830 74 72 76 66 72 72 71 65 83 99 ACTUAL ACTUAL WORKERS PRODUCTION 20 75 3.750 75 3,750 75 3,750 75 3,750 75 3,750 75 3,750 75 3.750 75 3,750 75 3,750 75 3,750 20 37,500 0 0 0 0 0 0 0 0 0 0 . 0 55 55 55 0 0 0 0 0 0 o 0 0 0 0 55 -****1335: 227 155 610 745 918 1,138 1,660 1,275 Totals 37.422 6,858 Costs Hiring: $16,500 Layoff $16.500 $ Inventory $102,870 Production $11,250,000 Cost of plan: $11,385,870 Information: Starting inventory Starting and ending workforce Hours worked per month per worker Production cost per unit: Hours per unit Hiring cost per worker Layoff cost per worker Monthly perunt holding cost: 0 20 160 $300 3.2 $300 $300 $15 Part b.) SALES IN WORKERS NEEDED BEEFEATER DEUTSCHLANDER AGGREGATE WORKER TO MEET SALES FORECAST FORECAST FORECAST HOURS AVERAGE - 75 MONTH LAYOFFS ENDING HIRINGS INVENTORY 27 10 Nov.19 Dec 19 Jan-20 Feb-20 Mar 20 Apr-20 May-20 Jun-20 Jul-20 Aug-20 650 676 624 624 696 475 566 819 754 982 3,048 2,899 3.198 2,671 2,919 3,102 2,964 2,409 3,381 3,965 3,698 3,575 3,822 3.295 3,615 3,577 3,530 3,228 4,135 4,947 11,834 11,440 12.230 10,544 11,568 11.446 11,296 10,330 13,232 15,830 74 72 76 66 72 72 71 65 83 99 ACTUAL ACTUAL WORKERS PRODUCTION 20 74 3,700 72 3,600 76 3,800 66 3,300 72 3,600 72 3.600 71 3,550 65 3,250 83 4,150 99 4,950 20 37,500 M 0 2 0 10 0 0 0 1 6 6 0 0 0 79 98 54 0 4 0 6 0 0 0 O 18 16 0 98 023525% 18 38 60 75 78 F Totals 37.422 308 Costs Hiring: $29.400 Layoff $29,400 Inventory $4.620 Production: $11.250.000 Cost of plan: $11,313,420 Information: Starting inventory Starting and ending workforce: Hours worked per month per worker Production cost per unit: Hours per unit: Hiring cost per worker Layoff cost per worker: Monthly per-unit holding cost: 0 20 160 $300 3.2 $300 $300 $15 Difference $72,450 Parte.) Part c.) The mix production plan is subjective, so if you follow part a and b in your solution, it is correct. Part d.) If hiring and layoff costs increased dramatically the level plan would be less expensive than the chase plan. This is because of the difference between the number of hirings and layoffs in the two plans. The chase plan is much more sensitive to changes in the hiring and layoff costs while the level plan is more sensitive to changes in inventory costs. However, the change in hiring and layoff costs would Given the information Above solve the questions below 1. Formulate the problem defined above using Linear Programming. Depict the linear programing model and use that format 2. Use Excel to find the optimal solutions as discussed in the class which are o Regular Production in each month rj The number of employees hired in each month xj o The number of employees fired in each month yj Extra units carried over as inventory in each month lj 3. Find the optimal total cost and compare it with the level, chase, and mixed production plan found in the solutions above


