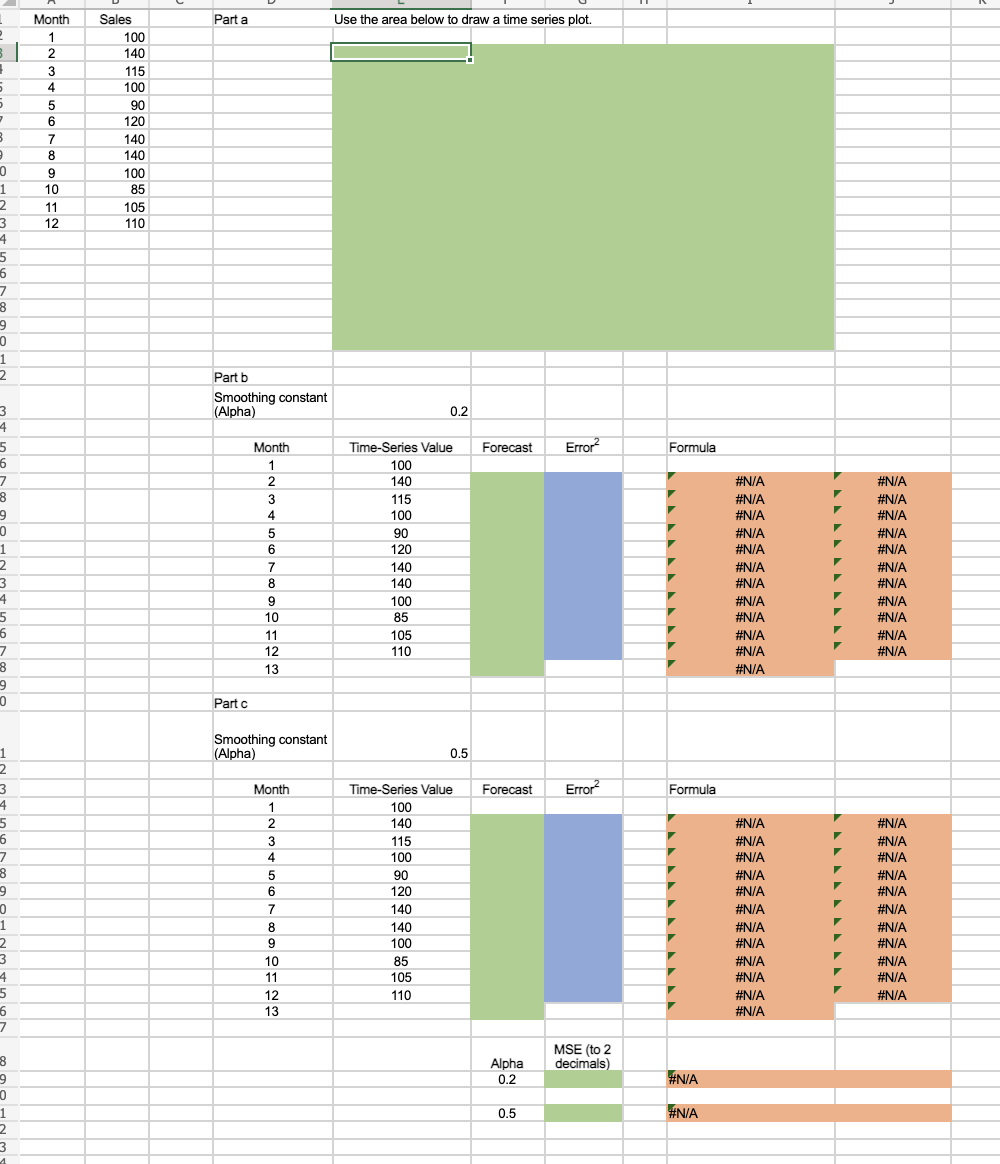
Question: Parta Use the area below to draw a time series plot. 3 5 Month 1 2 3 4 5 6 7 8 9 10 2

Parta Use the area below to draw a time series

Parta Use the area below to draw a time series plot. 3 5 Month 1 2 3 4 5 6 7 8 9 10 2 Sales 100 140 115 100 90 120 140 140 100 85 105 110 0 11 12 1 2 3 4 5 6 7 8 9 0 1 2 2 Part b Smoothing constant (Alpha) 0.2 Forecast Error? Formula 3 4 5 6 7 8 9 0 1 2. 3 4 5 6 7 3 Month 1 2 3 4 5 6 Time-Series Value 100 140 115 100 90 120 140 140 100 85 105 110 7 #N/A #N/A #N/A #N/A #N/A #N/A #N/A #N/A #N/A #N/A #N/A #N/A #N/A #N/A #N/A #N/A #N/A #N/A #N/A #N/A #N/A #N/A #N/A 8 9 10 11 12 13 0 0 Partc Smoothing constant (Alpha) 0.5 Forecast Error? Formula Month 1 2 3 1 2 3 3 4 5 6 7 8 9 0 1 2 3 4 5 6 7 7 4 5 6 7 8 9 Time-Series Value 100 140 115 100 90 120 140 140 100 85 105 110 #N/A #N/A #N/A #N/A #N/A #N/A #N/A #N/A #N/A #N/A #N/A #N/A #N/A #N/A #N/A #N/A #N/A #N/A #N/A #N/A #N/A #N/A #N/A 10 11 12 13 MSE (to 2 decimals) Alpha 0.2 #N/A 8 9 0 1 2 3 1 0.5 #N/A

Step by Step Solution

There are 3 Steps involved in it

1 Expert Approved Answer
Step: 1 Unlock blur-text-image
Question Has Been Solved by an Expert!

Get step-by-step solutions from verified subject matter experts

Step: 2 Unlock
Step: 3 Unlock

Students Have Also Explored These Related General Management Questions!