

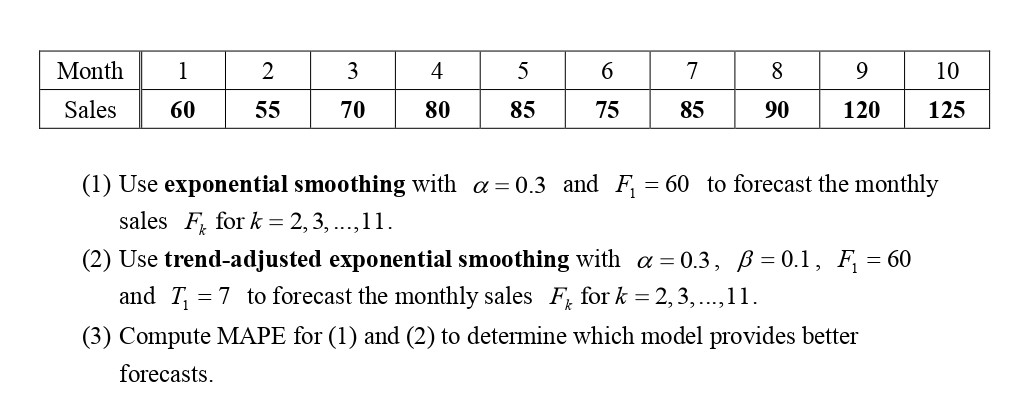
Question: FULL EXPLANATION and provide line chart OR time series plot (Q3) Month Sales 1 60 2 55 3 70 4 80 5 85 6 75
FULL EXPLANATION and provide line chart OR time series plot (Q3)
Step by Step Solution
There are 3 Steps involved in it
1 Expert Approved Answer
Step: 1 Unlock

Question Has Been Solved by an Expert!
Get step-by-step solutions from verified subject matter experts
Step: 2 Unlock
Step: 3 Unlock