

Question: PART-C (Any Five) (50 Marks) 10. The data represent number of workers of a company who were sick per day on 30 working days: 30
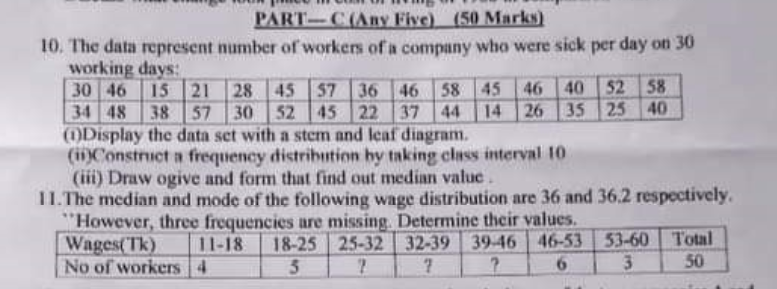
PART-C (Any Five) (50 Marks) 10. The data represent number of workers of a company who were sick per day on 30 working days: 30 46 15 21 28 45 36 46 58 45 46 40 52 58 34 48 38 57 30 52 45 22 37 44 14 26 35 25 40 (1)Display the data set with a stem and leaf diagram. (ii)Construct a frequency distribution by taking class interval 10 (iii) Draw ogive and form that find out median value . 1 1. The median and mode of the following wage distribution are 36 and 36.2 respectively. "However, three frequencies are missing. Determine their values. Wages(Tk) 11-18 18-25 25-32 32-39 39-46 46-53 53-60 Total No of workers 5 7 6 3 50
Step by Step Solution
There are 3 Steps involved in it
1 Expert Approved Answer
Step: 1 Unlock

Question Has Been Solved by an Expert!
Get step-by-step solutions from verified subject matter experts
Step: 2 Unlock
Step: 3 Unlock