

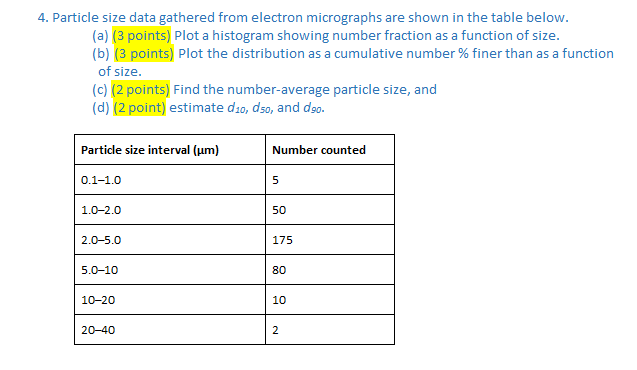
Question: Particle size data gathered from electron micrographs are shown in the table below. ( a ) ( 3 points ) Plot a histogram showing number
Particle size data gathered from electron micrographs are shown in the table below.
a points Plot a histogram showing number fraction as a function of size.
b points Plot the distribution as a cumulative number finer than as a function of size.
c points Find the numberaverage particle size, and
d point
Step by Step Solution
There are 3 Steps involved in it
1 Expert Approved Answer
Step: 1 Unlock

Question Has Been Solved by an Expert!
Get step-by-step solutions from verified subject matter experts
Step: 2 Unlock
Step: 3 Unlock