

Question: Please I need step-by-step answer to plot the filter efficiency graph. Please make sure you give a helpful answer for this question and DO NOT
Please I need step-by-step answer to plot the filter efficiency graph. Please make sure you give a helpful answer for this question and DO NOT COPY what other experts wrote before since this is my 3rd attempt uploading the same question and I'M GETTING ANSWERS NOT RELATED TO MY QUESTION IN ANYWAY.
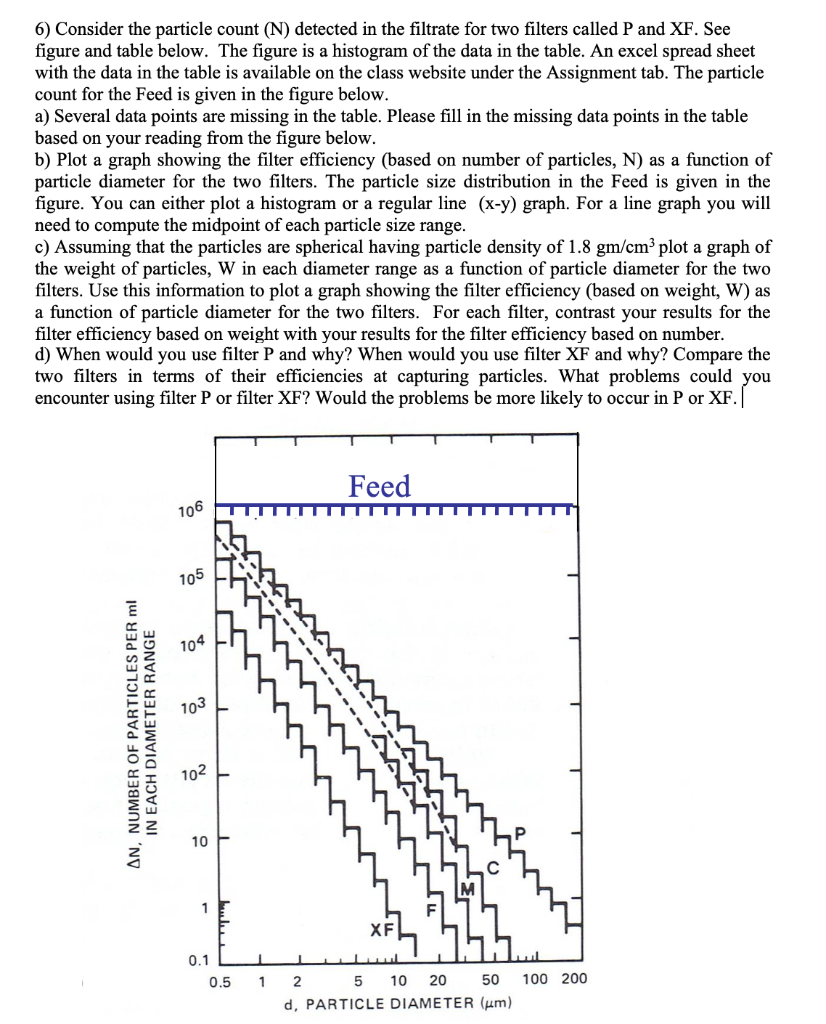
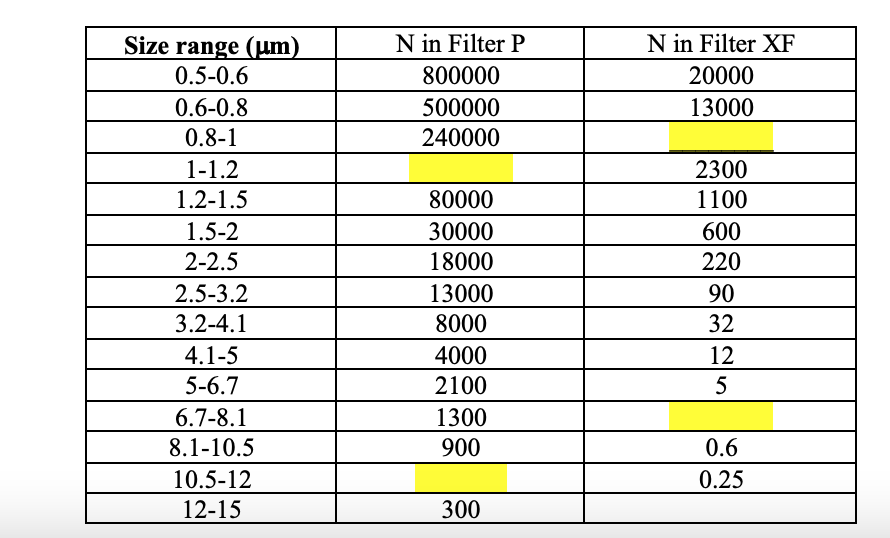
6) Consider the particle count (N) detected in the filtrate for two filters called P and XF. See figure and table below. The figure is a histogram of the data in the table. An excel spread sheet with the data in the table is available on the class website under the Assignment tab. The particle count for the Feed is given in the figure below. a) Several data points are missing in the table. Please fill in the missing data points in the table based on your reading from the figure below. b) Plot a graph showing the filter efficiency (based on number of particles, N) as a function of particle diameter for the two filters. The particle size distribution in the Feed is given in the figure. You can either plot a histogram or a regular line (x-y) graph. For a line graph you will need to compute the midpoint of each particle size range. c) Assuming that the particles are spherical having particle density of 1.8gm/cm3 plot a graph of the weight of particles, W in each diameter range as a function of particle diameter for the two filters. Use this information to plot a graph showing the filter efficiency (based on weight, W) as a function of particle diameter for the two filters. For each filter, contrast your results for the filter efficiency based on weight with your results for the filter efficiency based on number. d) When would you use filter P and why? When would you use filter XF and why? Compare the two filters in terms of their efficiencies at capturing particles. What problems could you encounter using filter P or filter XF? Would the problems be more likely to occur in P or XF. \begin{tabular}{|c|c|c|} \hline Size range (m) & N in Filter P & N in Filter XF \\ \hline 0.50.6 & 800000 & 20000 \\ \hline 0.60.8 & 500000 & 13000 \\ \hline 0.81 & 240000 & \\ \hline 11.2 & & 2300 \\ \hline 1.21.5 & 80000 & 1100 \\ \hline 1.52 & 30000 & 600 \\ \hline 22.5 & 18000 & 220 \\ \hline 2.53.2 & 13000 & 90 \\ \hline 3.24.1 & 8000 & 32 \\ \hline 4.15 & 4000 & 12 \\ \hline 56.7 & 2100 & 5 \\ \hline 6.78.1 & 1300 & \\ \hline 8.110.5 & 900 & 0.6 \\ \hline 10.512 & & 0.25 \\ \hline 1215 & 300 & \\ \hline \end{tabular} 6) Consider the particle count (N) detected in the filtrate for two filters called P and XF. See figure and table below. The figure is a histogram of the data in the table. An excel spread sheet with the data in the table is available on the class website under the Assignment tab. The particle count for the Feed is given in the figure below. a) Several data points are missing in the table. Please fill in the missing data points in the table based on your reading from the figure below. b) Plot a graph showing the filter efficiency (based on number of particles, N) as a function of particle diameter for the two filters. The particle size distribution in the Feed is given in the figure. You can either plot a histogram or a regular line (x-y) graph. For a line graph you will need to compute the midpoint of each particle size range. c) Assuming that the particles are spherical having particle density of 1.8gm/cm3 plot a graph of the weight of particles, W in each diameter range as a function of particle diameter for the two filters. Use this information to plot a graph showing the filter efficiency (based on weight, W) as a function of particle diameter for the two filters. For each filter, contrast your results for the filter efficiency based on weight with your results for the filter efficiency based on number. d) When would you use filter P and why? When would you use filter XF and why? Compare the two filters in terms of their efficiencies at capturing particles. What problems could you encounter using filter P or filter XF? Would the problems be more likely to occur in P or XF. \begin{tabular}{|c|c|c|} \hline Size range (m) & N in Filter P & N in Filter XF \\ \hline 0.50.6 & 800000 & 20000 \\ \hline 0.60.8 & 500000 & 13000 \\ \hline 0.81 & 240000 & \\ \hline 11.2 & & 2300 \\ \hline 1.21.5 & 80000 & 1100 \\ \hline 1.52 & 30000 & 600 \\ \hline 22.5 & 18000 & 220 \\ \hline 2.53.2 & 13000 & 90 \\ \hline 3.24.1 & 8000 & 32 \\ \hline 4.15 & 4000 & 12 \\ \hline 56.7 & 2100 & 5 \\ \hline 6.78.1 & 1300 & \\ \hline 8.110.5 & 900 & 0.6 \\ \hline 10.512 & & 0.25 \\ \hline 1215 & 300 & \\ \hline \end{tabular}
Step by Step Solution
There are 3 Steps involved in it

Get step-by-step solutions from verified subject matter experts