

Question: Part-II 4. Make a m-file and write MATLAB commands in it to accomplish the following: Evaluation of sin(x) for the following values of x: 0,
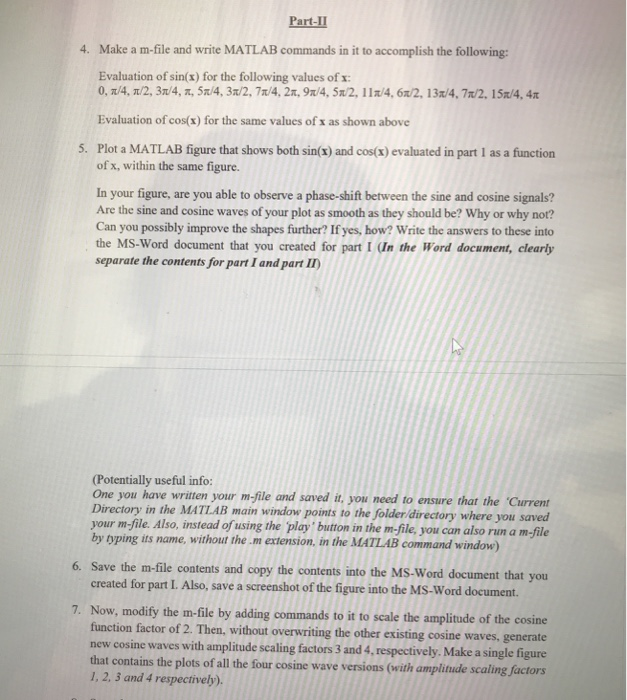
Part-II 4. Make a m-file and write MATLAB commands in it to accomplish the following: Evaluation of sin(x) for the following values of x: 0, 1/4, 1/2, 3/4, 7, 5x/4, 3/2, 7/4, 21, 91/4, 5x2, 112/4,6x/2, 13./4. 71/2, 152/4, 410 Evaluation of cos(x) for the same values of x as shown above 5. Plot a MATLAB figure that shows both sin(x) and cos(x) evaluated in part 1 as a function of x, within the same figure. In your figure, are you able to observe a phase-shift between the sine and cosine signals? Are the sine and cosine waves of your plot as smooth as they should be? Why or why not? Can you possibly improve the shapes further? If yes, how? Write the answers to these into the MS-Word document that you created for part I (In the Word document, clearly separate the contents for part I and part II) (Potentially useful info: One you have written your m-file and saved it, you need to ensure that the 'Current Directory in the MATLAB main window points to the folder/directory where you saved your m-file. Also, instead of using the play button in the m-file, you can also run a m-file by typing its name, without them extension, in the MATLAB command window) 6. Save the m-file contents and copy the contents into the MS-Word document that you created for part I. Also, save a screenshot of the figure into the MS-Word document. 7. Now, modify the m-file by adding commands to it to scale the amplitude of the cosine function factor of 2. Then, without overwriting the other existing cosine waves, generate new cosine waves with amplitude scaling factors 3 and 4. respectively. Make a single figure that contains the plots of all the four cosine wave versions (with amplitude scaling factors 1, 2, 3 and 4 respectively)
Step by Step Solution
There are 3 Steps involved in it

Get step-by-step solutions from verified subject matter experts