Question: Parts C and D please. The table below indicates the feasibility of crashing each of the activities in this project and the related per-week costs

Parts C and D please.Parts C and D please. The table below indicates

The table below indicates the feasibility of crashing each of the activities in this project and the related per-week costs to reduce an activity. Activity Cost per Week $750 $1700 A B D E F Time Required (weeks) 3 4 3 5 4 3 Minimum Feasible Time (weeks) 2 3 3 3 3 3 $1900 $1850 (C) If this project must be completed in 12 weeks, clearly explain the least expensive way to accomplish this. (d) Returning to the original project of parts (a) and (b), it has been determined that the task completion times for task C have the following distribution: Probability Time Required (weeks) 0.5 2 3 4 5 0.2 0.2 0.2 0.2 0.2 What is the corresponding distribution of project completion times? The table below indicates the feasibility of crashing each of the activities in this project and the related per-week costs to reduce an activity. Activity Cost per Week $750 $1700 A B D E F Time Required (weeks) 3 4 3 5 4 3 Minimum Feasible Time (weeks) 2 3 3 3 3 3 $1900 $1850 (C) If this project must be completed in 12 weeks, clearly explain the least expensive way to accomplish this. (d) Returning to the original project of parts (a) and (b), it has been determined that the task completion times for task C have the following distribution: Probability Time Required (weeks) 0.5 2 3 4 5 0.2 0.2 0.2 0.2 0.2 What is the corresponding distribution of project completion times

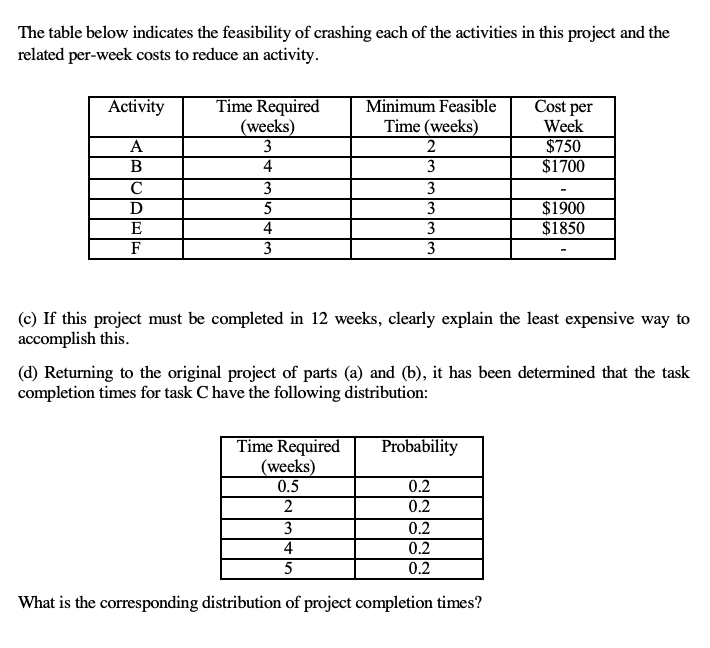
Step by Step Solution

There are 3 Steps involved in it

1 Expert Approved Answer
Step: 1 Unlock blur-text-image
Question Has Been Solved by an Expert!

Get step-by-step solutions from verified subject matter experts

Step: 2 Unlock
Step: 3 Unlock

Students Have Also Explored These Related General Management Questions!