

Question: Predict the dataset by drawing a decision tree using Gini index. Show the calculation. Setting separation for A=5.0, B=3.0, C=4.2 and D=1.4. Patient ID
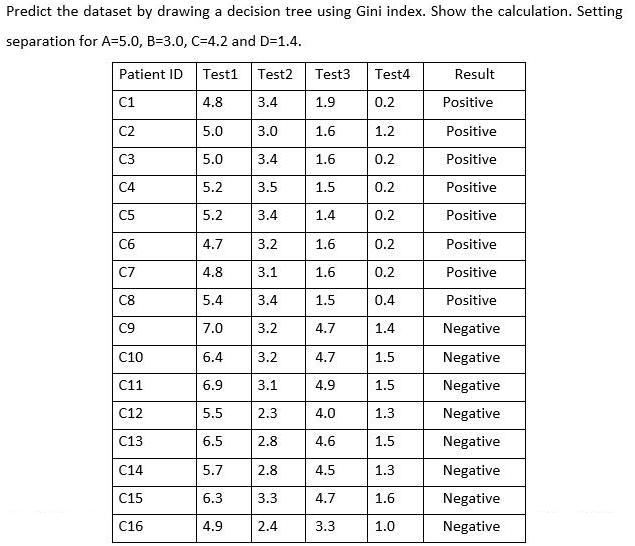
Predict the dataset by drawing a decision tree using Gini index. Show the calculation. Setting separation for A=5.0, B=3.0, C=4.2 and D=1.4. Patient ID Test1 Test2 Test3 Test4 Result C1 4.8 3.4 1.9 0.2 Positive C2 5.0 3.0 1.6 1.2 Positive C3 5.0 3.4 1.6 0.2 Positive C4 5.2 3.5 1.5 0.2 Positive C5 5.2 3.4 1.4 0.2 Positive C6 4.7 3.2 1.6 0.2 Positive C7 4.8 3.1 1.6 0.2 Positive C8 5.4 3.4 1.5 0.4 Positive C9 7.0 3.2 4.7 1.4 Negative C10 6.4 3.2 4.7 1.5 Negative C11 6.9 3.1 4.9 1.5 Negative C12 5.5 2.3 4.0 1.3 Negative C13 6.5 2.8 4.6 1.5 Negative C14 5.7 2.8 4.5 1.3 Negative C15 6.3 3.3 4.7 1.6 Negative C16 4.9 2.4 3.3 1.0 Negative
Step by Step Solution
3.48 Rating (158 Votes )
There are 3 Steps involved in it
Lets consider the dataset in the image below and draw a decision tree using g... View full answer

Get step-by-step solutions from verified subject matter experts
Document Format (2 attachments)
6361bf175420c_235957.pdf
180 KBs PDF File
6361bf175420c_235957.docx
120 KBs Word File