

Question: The following model is based on data about outside temperature and cold drink sales at FAU Stadium during football season. What percent of the variability
- The following model is based on data about outside temperature and cold drink sales at FAU Stadium during football season.
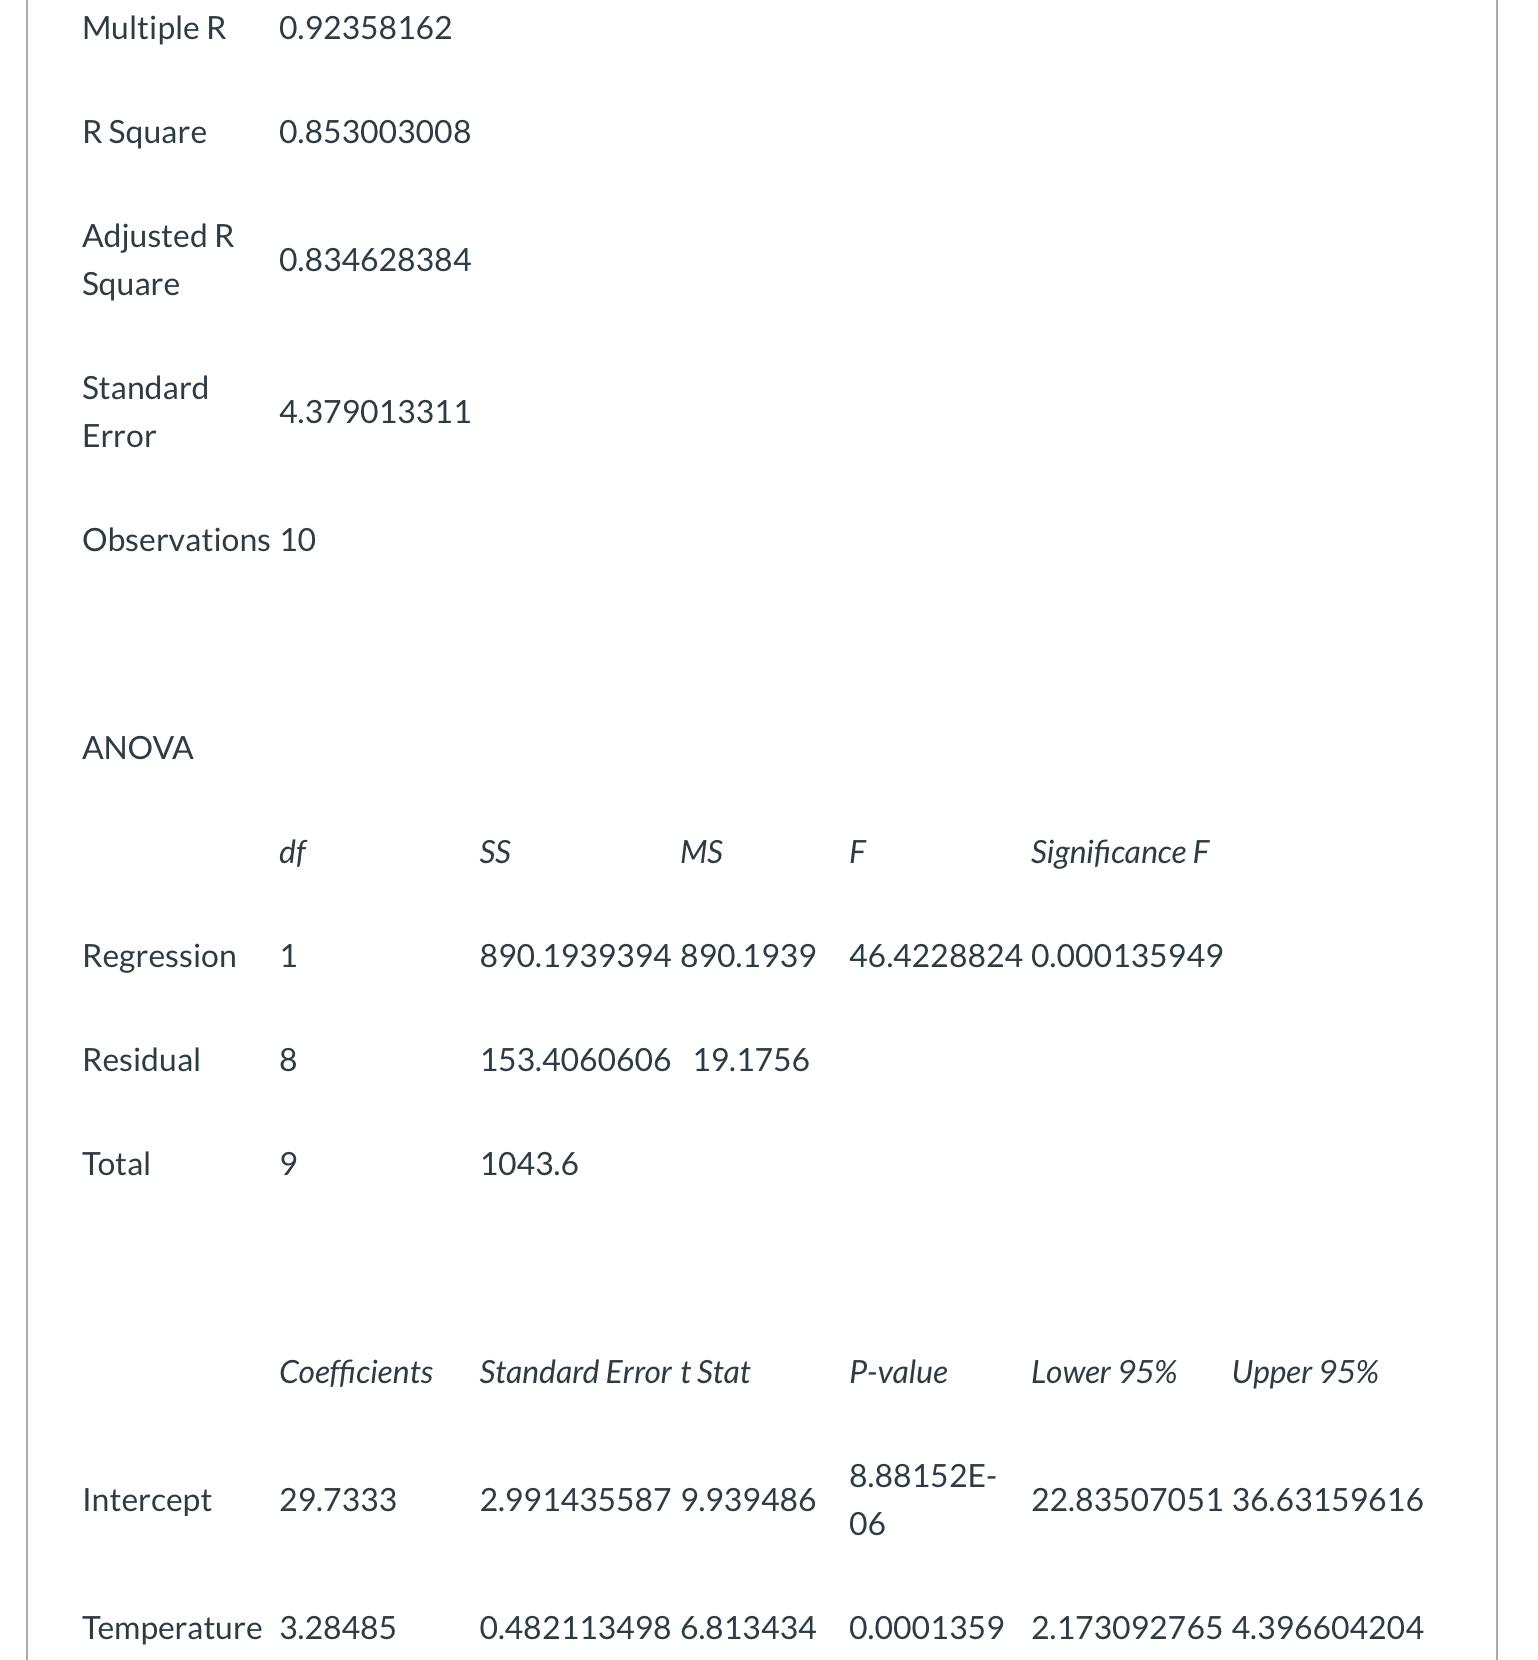 What percent of the variability in the number cold drinks sold can be attributed to temperature?
Multiple R 0.92358162 R Square 0.853003008 Adjusted R Square Standard Error ANOVA Observations 10 0.834628384 Residual 4.379013311 Total Regression 1 df 8 9 Intercept 29.7333 SS Temperature 3.28485 MS 153.4060606 19.1756 1043.6 Coefficients Standard Error t Stat 890.1939394 890.1939 46.4228824 0.000135949 F 2.991435587 9.939486 P-value Significance F 8.88152E- 06 Lower 95% Upper 95% 22.83507051 36.63159616 0.482113498 6.813434 0.0001359 2.173092765 4.396604204
Step by Step Solution
There are 3 Steps involved in it
The detailed answer for the above question is provided below The coefficient of ... View full answer

Get step-by-step solutions from verified subject matter experts