

Question: The following model is based on data about outside temperature and cold drink sales at FAU Stadium during football season. SUMMARY OUTPUT Regression Statistics Multiple
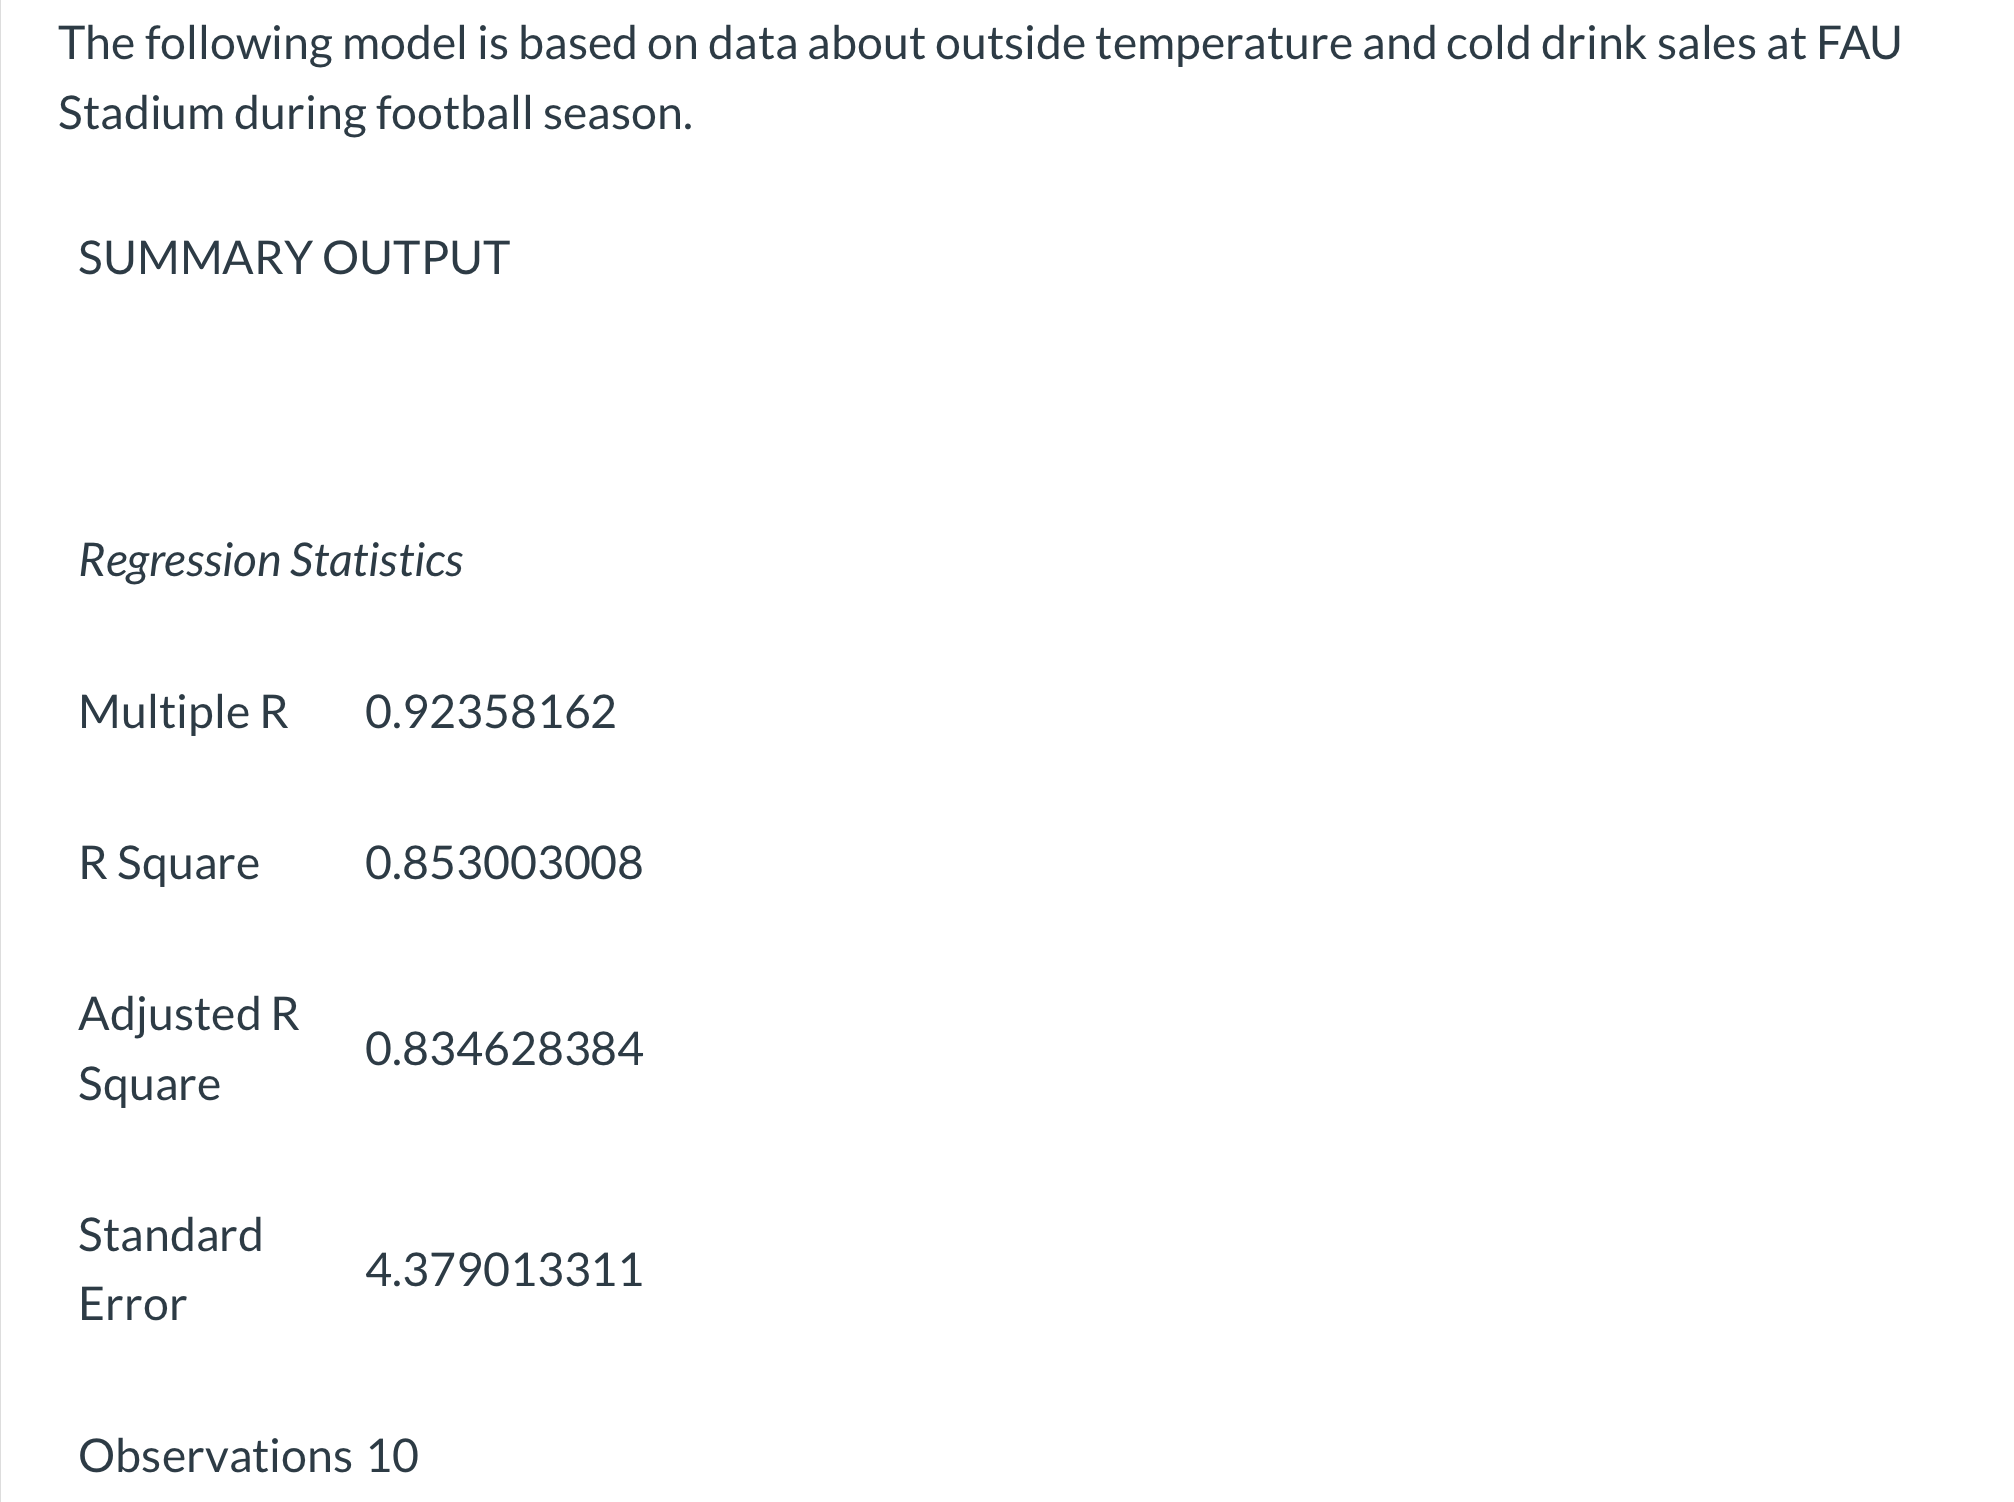
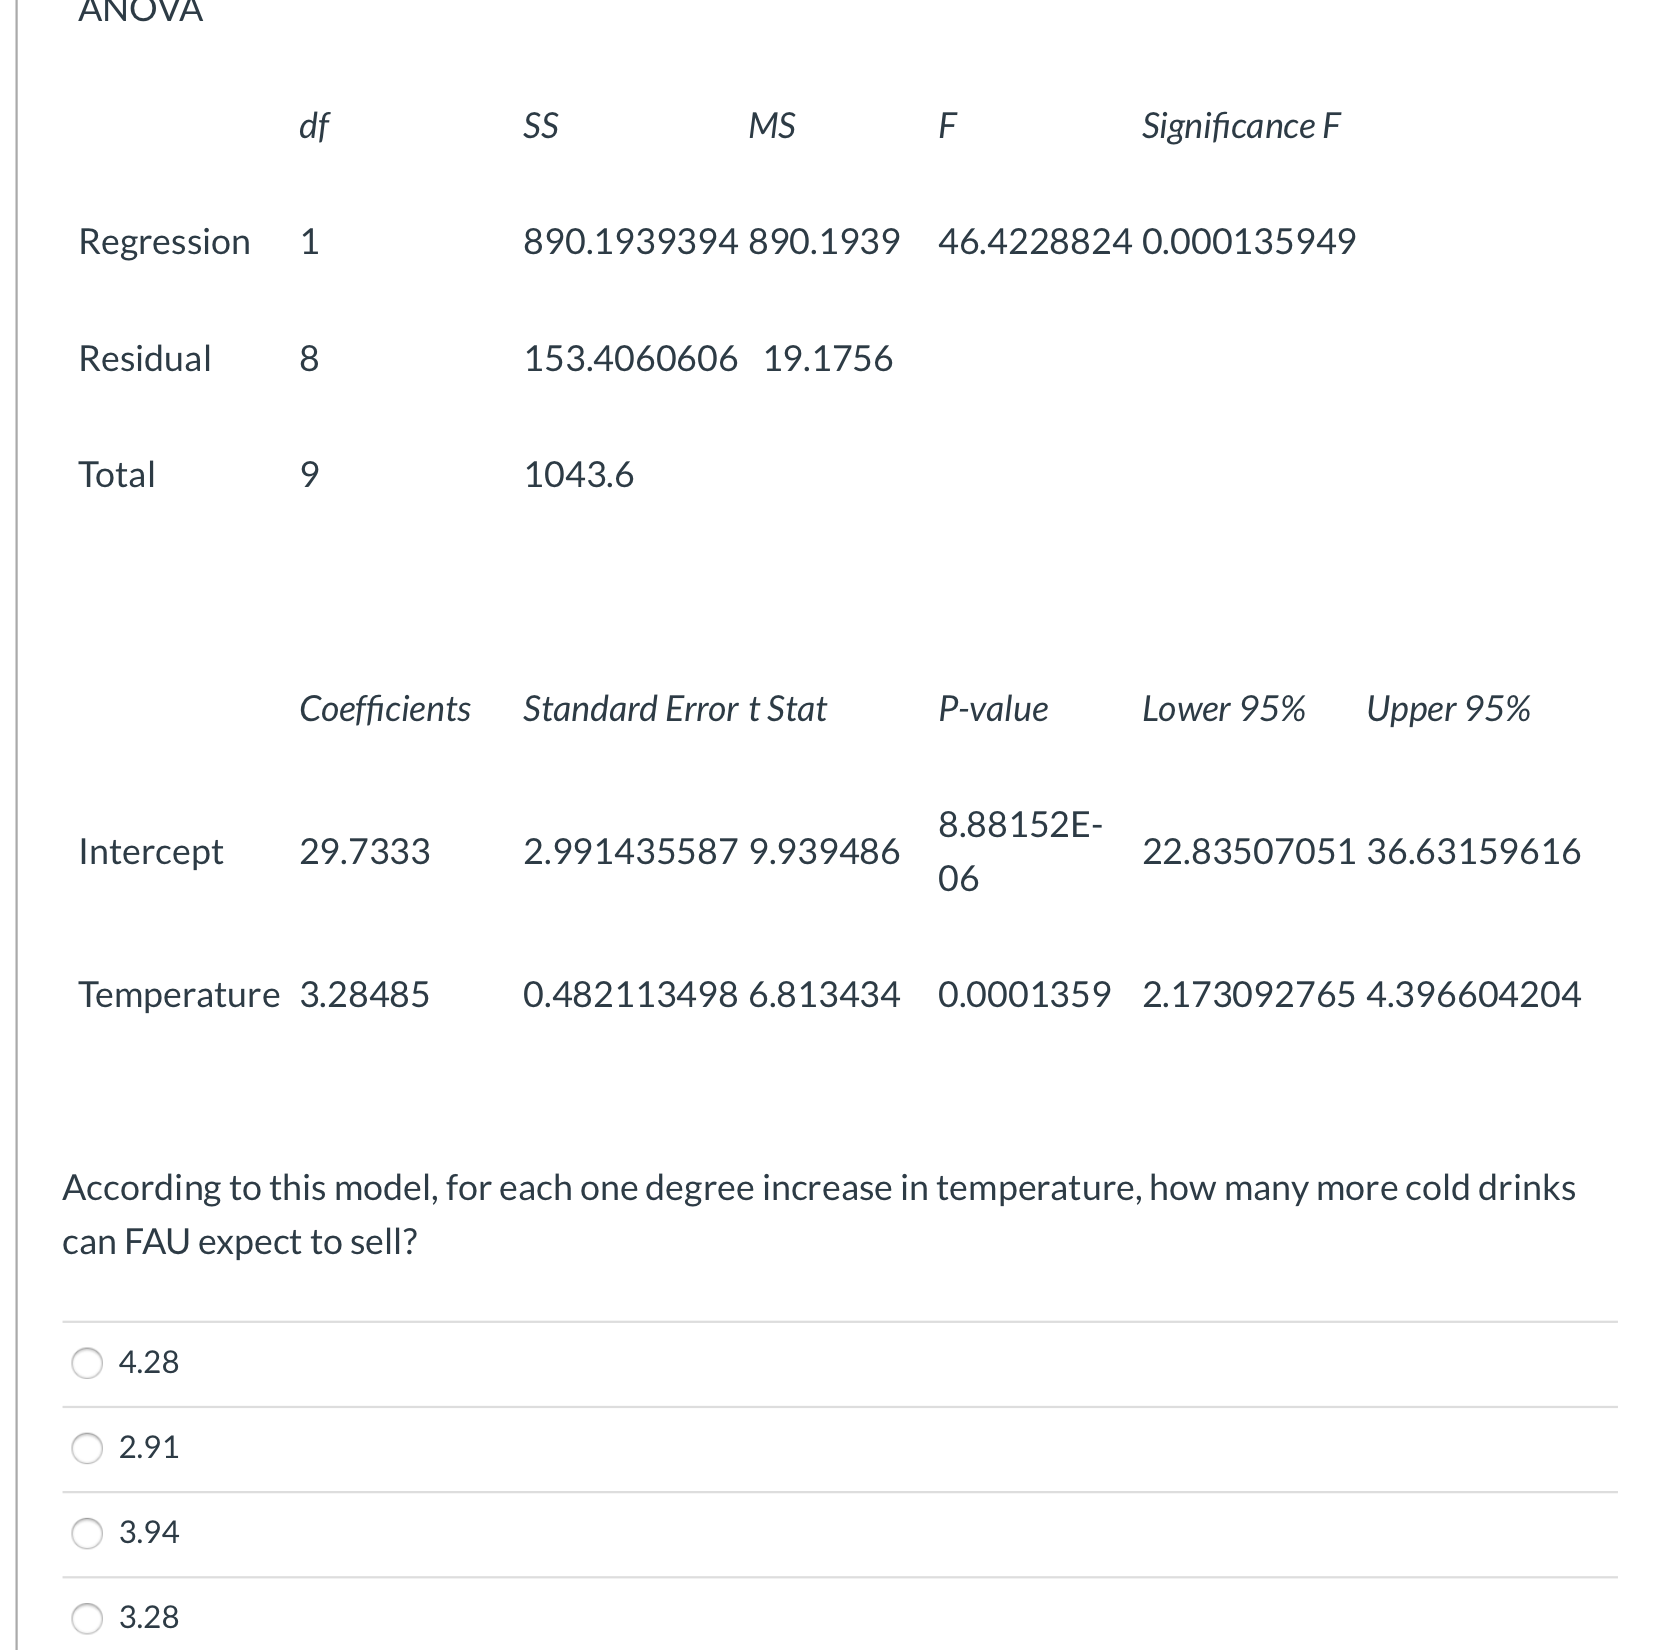
The following model is based on data about outside temperature and cold drink sales at FAU Stadium during football season. SUMMARY OUTPUT Regression Statistics Multiple R 092358162 R Square 0.853003008 Adjusted R 0.834628384 Square Standard 4.379013311 Error Observations 10 ANOVA df SS MS F Significance F Regression 1 890.1939394 890.1939 46.4228824 0.000135949 Residual 8 153.4060606 19.1756 Total 9 1043.6 Coefficients Standard Error t Stat P-value Lower 95% Upper 95% Intercept 29.7333 2.991435587 9.939486 8.88152E- 06 22.83507051 36.63159616 Temperature 3.28485 0.482113498 6.813434 0.0001359 2.173092765 4.396604204 According to this model, for each one degree increase in temperature, how many more cold drinks can FAU expect to sell? 4.28 O 2.91 3.94 3.28
Step by Step Solution
There are 3 Steps involved in it

Get step-by-step solutions from verified subject matter experts