

Question: PC7 PC8 Consider the following output from a Principal Components Analysis: Factor Loadings for Swap Data PC1 PC2 PC3 PC4 PC5 PC6 1-year 0.216 -0.501
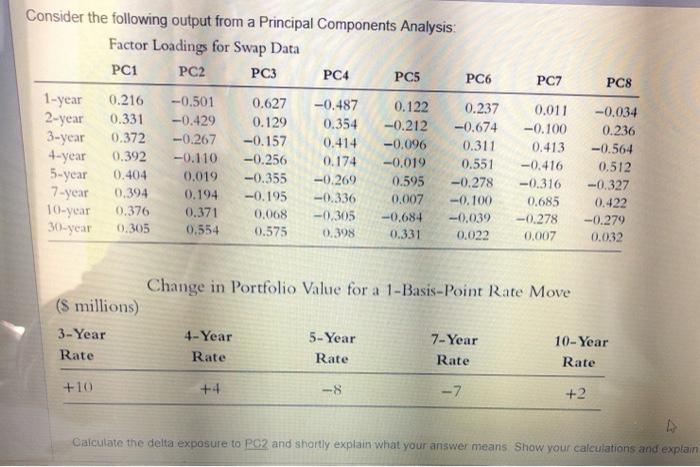
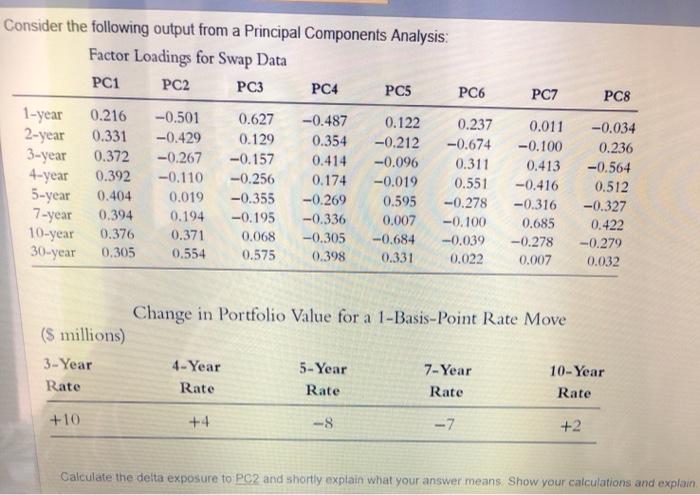
PC7 PC8 Consider the following output from a Principal Components Analysis: Factor Loadings for Swap Data PC1 PC2 PC3 PC4 PC5 PC6 1-year 0.216 -0.501 0.627 -0.487 0.122 0.237 2-year 0.331 -0.429 0.129 0.354 -0.212 -0.674 3-year 0.372 -0.267 -0.157 0.414 -0.096 0.311 4-year 0.392 -0.110 -0.256 0.174 -0.019 0.551 5-year 0.404 0.019 -0.355 -0.269 0.595 -0.278 7-year 0.394 0.194 -0.195 -0.336 0.007 -0.100 10-year 0.376 0.371 0.068 -0.305 -0.684 -0.039 30-year 0.305 0.554 0.575 0.398 0.331 0.022 0.011 -0.100 0.413 -0.416 -0.316 0.685 -0.278 0.007 -0.034 0.236 -0.564 0.512 -0.327 0.422 -0.279 0.032 Change in Portfolio Value for a 1-Basis-Point Rate Move (8 millions) 3-Year Rate 4-Year Rate 5-Year Rate 7-Year Rate 10-Year Rate +10 +4 -8 -7 +2 Calculate the delta exposure to PO2 and shortly explain what your answer means Show your calculations and explain PC7 PC8 Consider the following output from a Principal Components Analysis: Factor Loadings for Swap Data PC1 PC2 PC3 PC4 PC5 PC6 1-year 0.216 -0.501 0.627 -0.487 0.122 0.237 2-year 0.331 -0.429 0.129 0.354 -0.212 -0.674 3-year 0.372 -0.267 -0.157 0.414 -0.096 0.311 4-year 0.392 -0.110 -0.256 0.174 -0.019 0.551 5-year 0.404 0.019 -0.355 -0.269 0.595 -0.278 7-year 0.394 0.194 -0.195 -0.336 0.007 -0.100 10-year 0.376 0.371 0,068 -0.305 -0.684 -0.039 30-year 0.305 0.554 0.575 0.398 0.331 0.022 0.011 -0.100 0.413 -0.416 -0.316 0.685 -0.278 0.007 -0.034 0.236 -0.564 0.512 -0.327 0.422 -0.279 0.032 Change in Portfolio Value for a 1-Basis-Point Rate Move (5 millions) 3-Year 4-Year 5-Year 7-Year 10-Year Rate Rate Rate Rate Rate +10 +4 -7 +2 Calculate the delta exposure to PC2 and shortly explain what your answer means Show your calculations and explain PC7 PC8 Consider the following output from a Principal Components Analysis: Factor Loadings for Swap Data PC1 PC2 PC3 PC4 PC5 PC6 1-year 0.216 -0.501 0.627 -0.487 0.122 0.237 2-year 0.331 -0.429 0.129 0.354 -0.212 -0.674 3-year 0.372 -0.267 -0.157 0.414 -0.096 0.311 4-year 0.392 -0.110 -0.256 0.174 -0.019 0.551 5-year 0.404 0.019 -0.355 -0.269 0.595 -0.278 7-year 0.394 0.194 -0.195 -0.336 0.007 -0.100 10-year 0.376 0.371 0.068 -0.305 -0.684 -0.039 30-year 0.305 0.554 0.575 0.398 0.331 0.022 0.011 -0.100 0.413 -0.416 -0.316 0.685 -0.278 0.007 -0.034 0.236 -0.564 0.512 -0.327 0.422 -0.279 0.032 Change in Portfolio Value for a 1-Basis-Point Rate Move (8 millions) 3-Year Rate 4-Year Rate 5-Year Rate 7-Year Rate 10-Year Rate +10 +4 -8 -7 +2 Calculate the delta exposure to PO2 and shortly explain what your answer means Show your calculations and explain PC7 PC8 Consider the following output from a Principal Components Analysis: Factor Loadings for Swap Data PC1 PC2 PC3 PC4 PC5 PC6 1-year 0.216 -0.501 0.627 -0.487 0.122 0.237 2-year 0.331 -0.429 0.129 0.354 -0.212 -0.674 3-year 0.372 -0.267 -0.157 0.414 -0.096 0.311 4-year 0.392 -0.110 -0.256 0.174 -0.019 0.551 5-year 0.404 0.019 -0.355 -0.269 0.595 -0.278 7-year 0.394 0.194 -0.195 -0.336 0.007 -0.100 10-year 0.376 0.371 0,068 -0.305 -0.684 -0.039 30-year 0.305 0.554 0.575 0.398 0.331 0.022 0.011 -0.100 0.413 -0.416 -0.316 0.685 -0.278 0.007 -0.034 0.236 -0.564 0.512 -0.327 0.422 -0.279 0.032 Change in Portfolio Value for a 1-Basis-Point Rate Move (5 millions) 3-Year 4-Year 5-Year 7-Year 10-Year Rate Rate Rate Rate Rate +10 +4 -7 +2 Calculate the delta exposure to PC2 and shortly explain what your answer means Show your calculations and explain
Step by Step Solution
There are 3 Steps involved in it

Get step-by-step solutions from verified subject matter experts