

Question: Penfolds Mining Group Ltd Audit Case Study Penfolds Mining Group Ltd Company Background The Entity Penfolds Mining Group Ltd, a company with its headquarters in
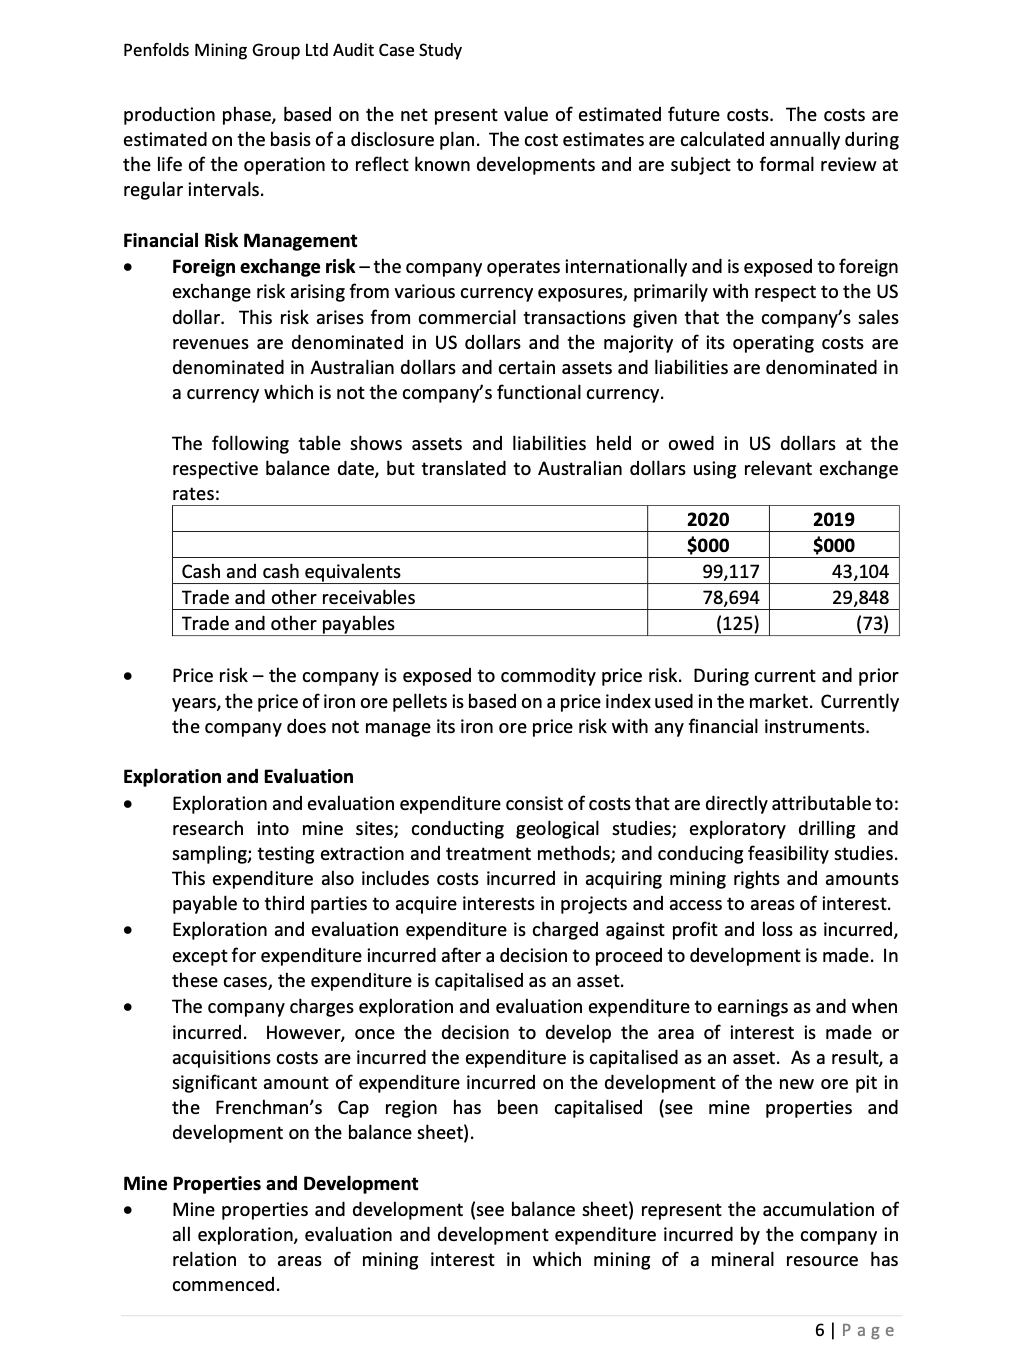
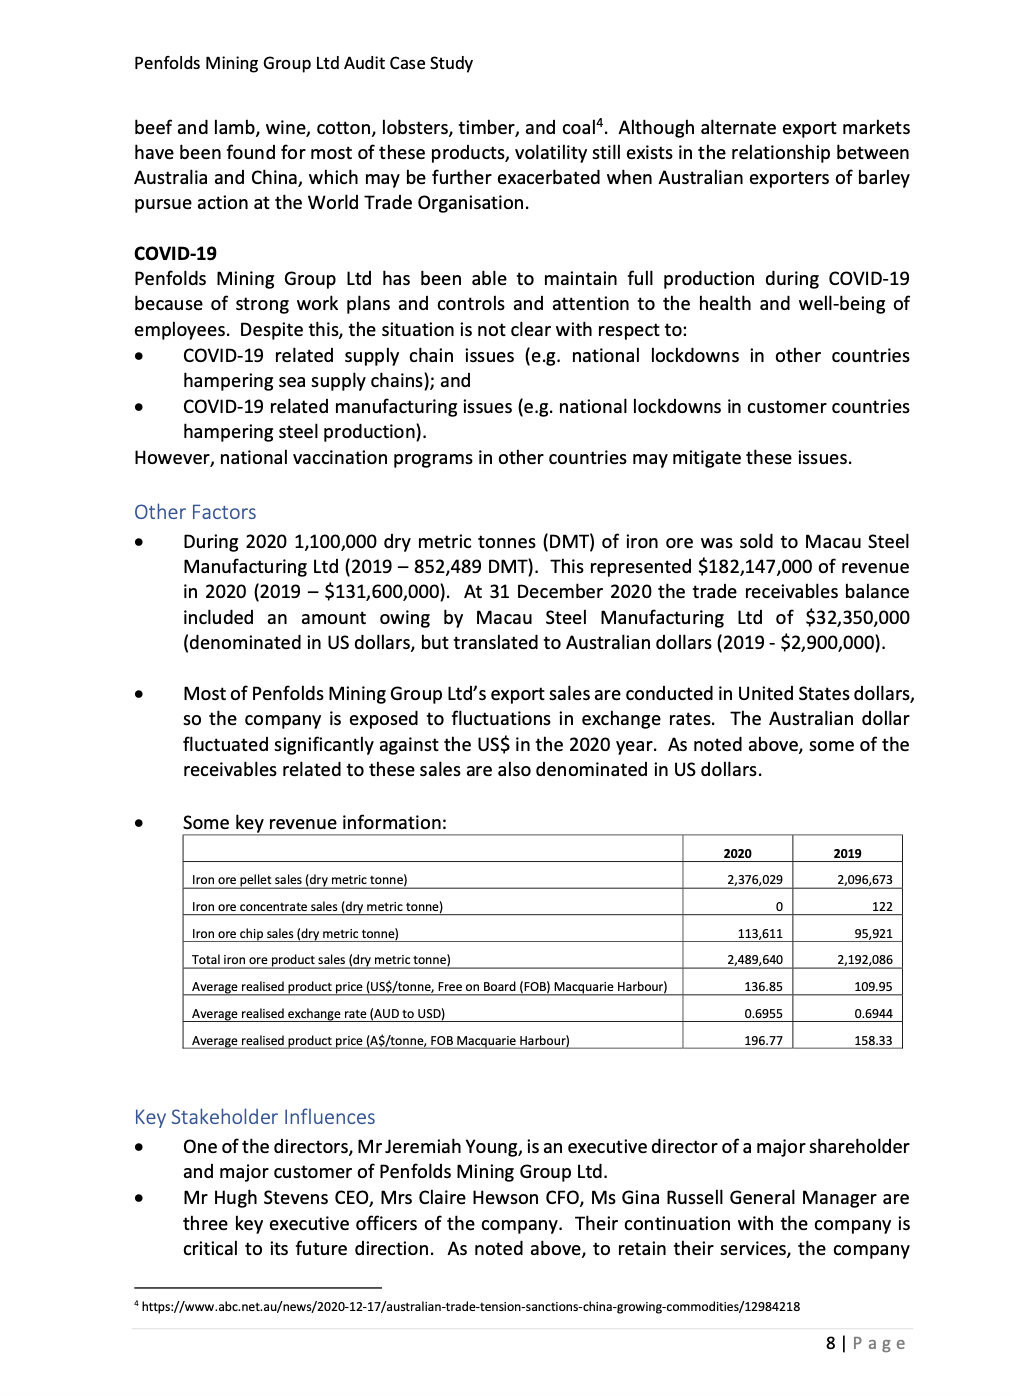
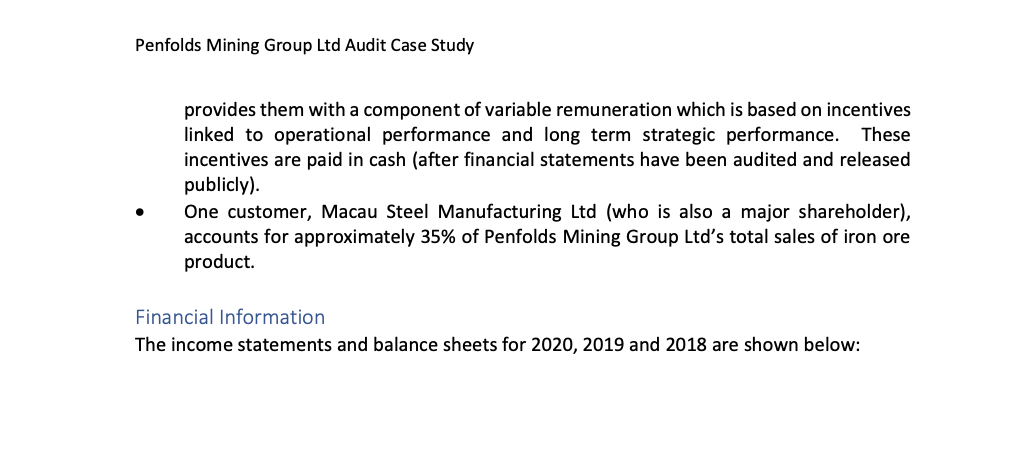
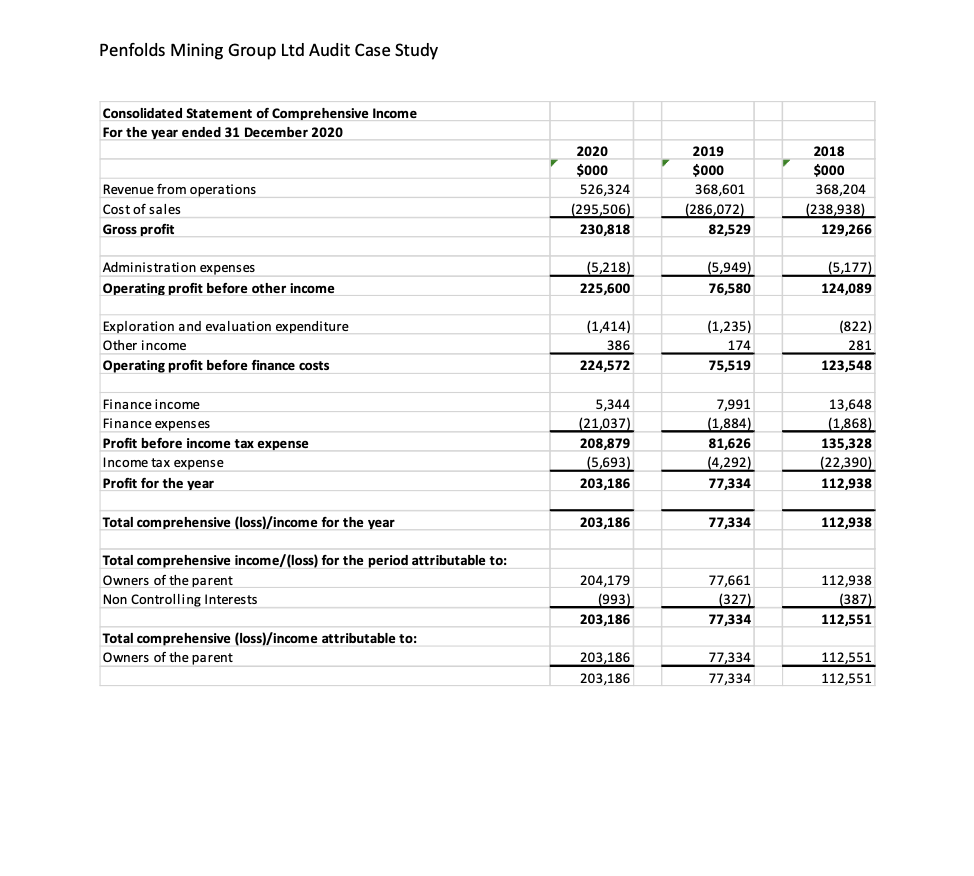
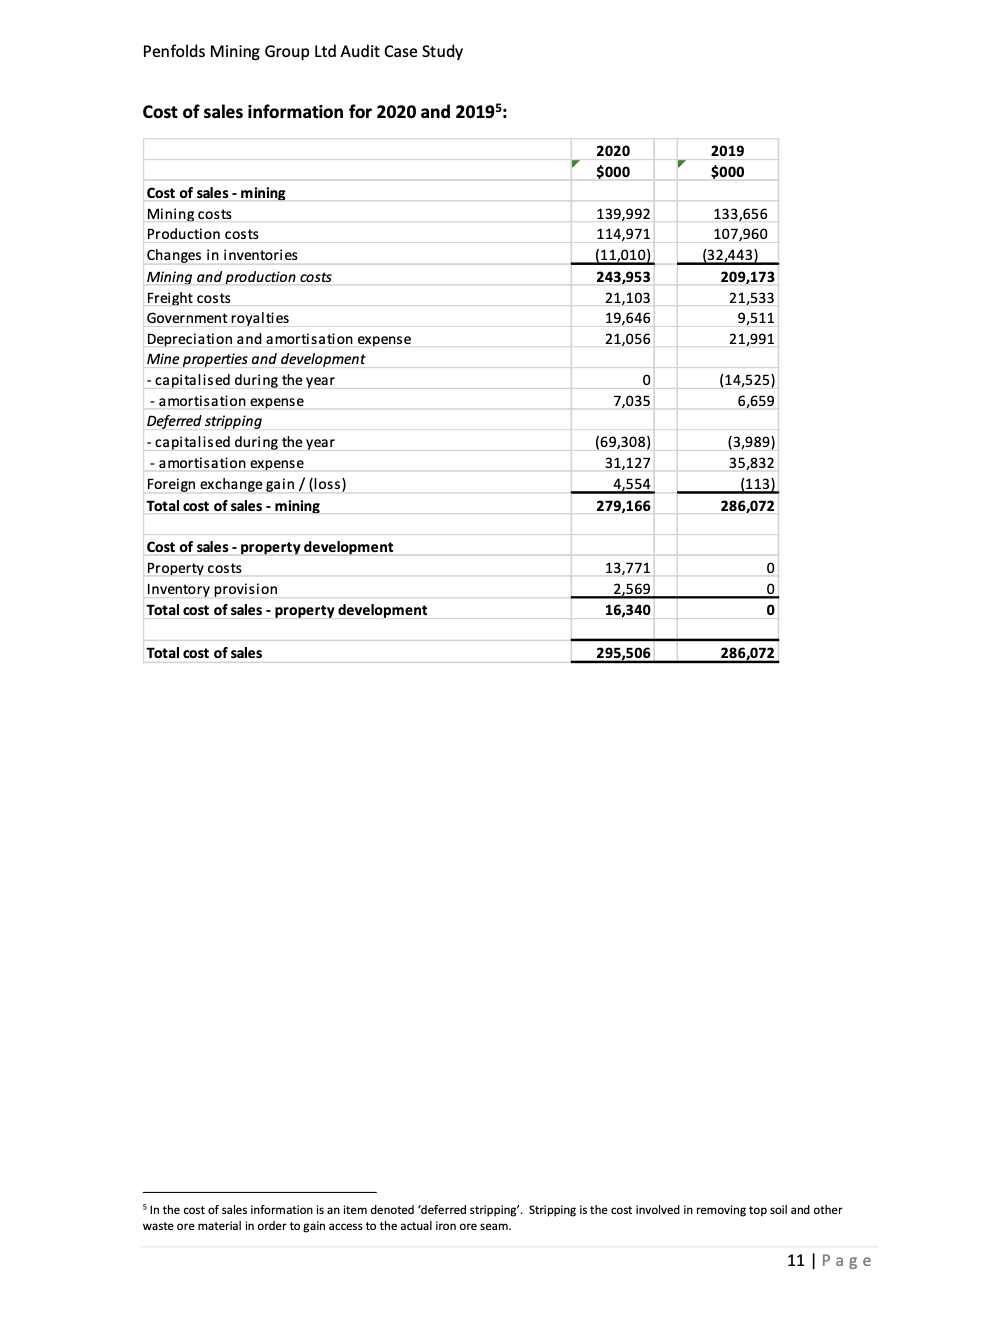
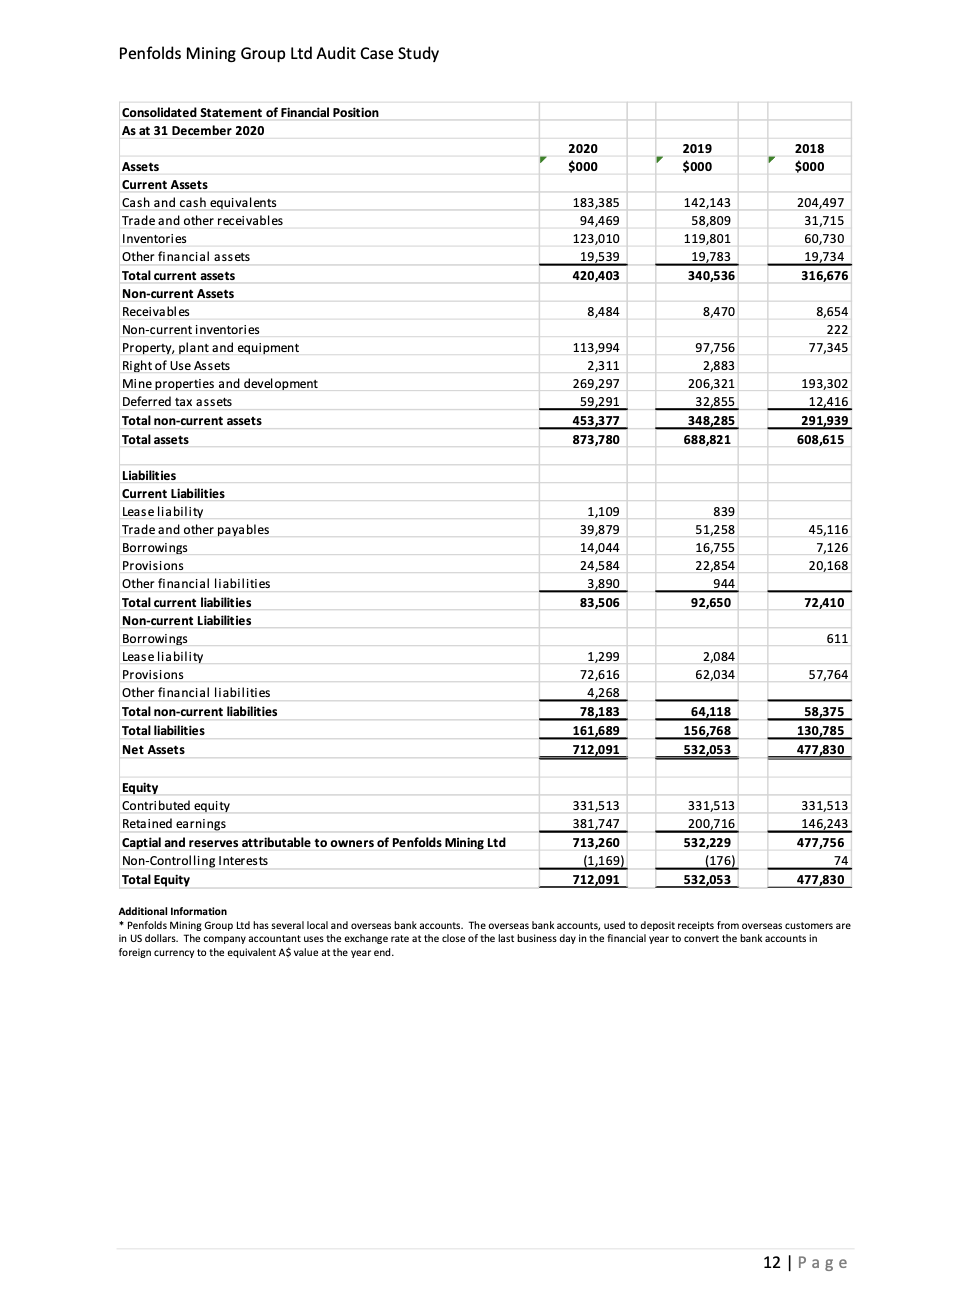
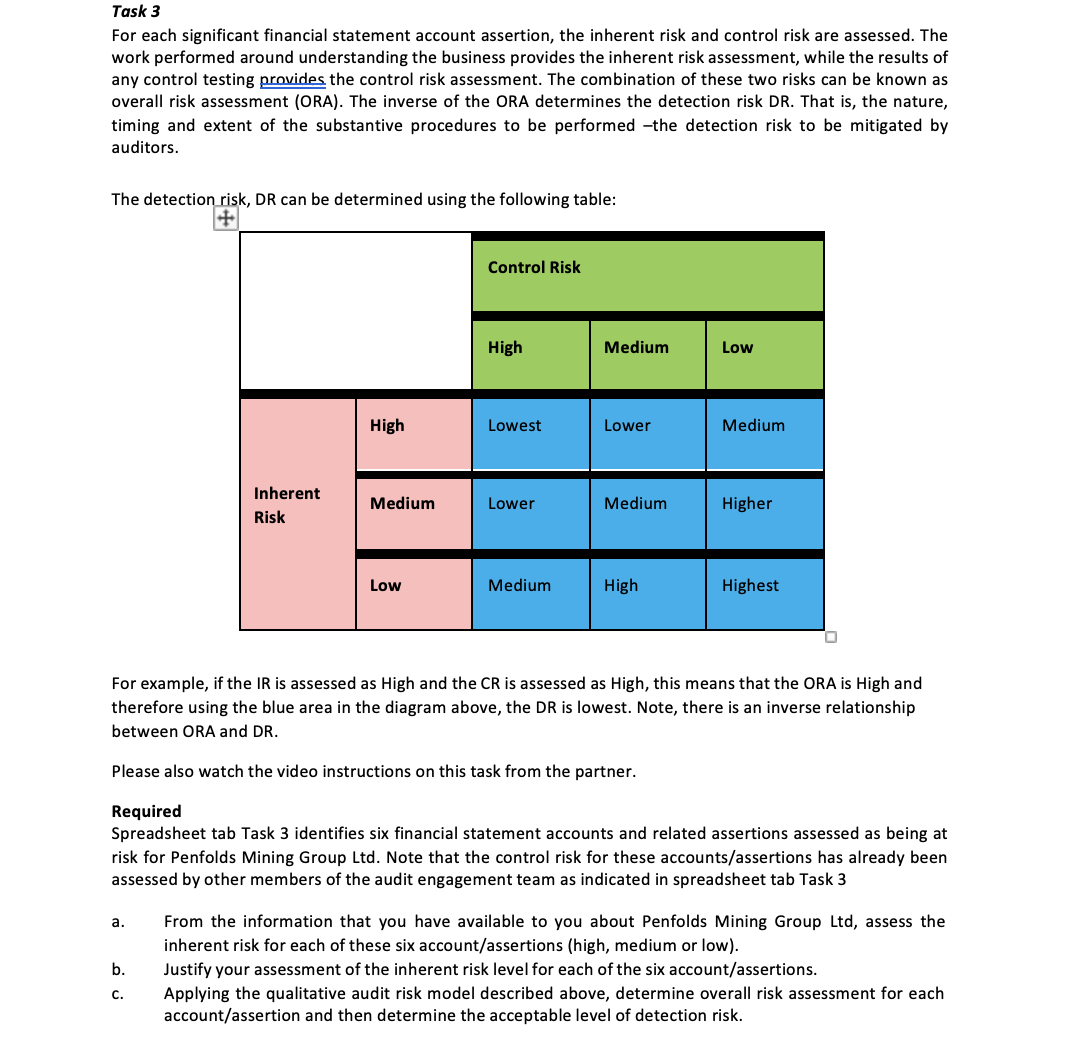
Penfolds Mining Group Ltd Audit Case Study Penfolds Mining Group Ltd Company Background The Entity Penfolds Mining Group Ltd, a company with its headquarters in Hobart, Tasmania, has been listed on the Australian Securities Exchange (ASK) since 1986. Penfolds operates an open-pit mine in the Frenchman's Cap area of Western Tasmania and mines magnetite iron ore, a mineral that is used in the production of steel. The company operates under several mining leases that encompass not only the open pit mine, but also: a concentrator plant facility; a 100 km pipeline from the Frenchman's Cap mine site to Macquarie Harbour; a pelletizing plant at Macquarie Harbour; and a bulk loading port facility at Macquarie Harbour. Operations The main product of Penfolds Mining Group Ltd is magnetite iron ore pellets {although there are two other by-products that are also sold iron ore concentrate and iron ore chips). Essentially, magnetite iron ore is extracted at the Frenchman's Cap site from open cut pits through drilling, blasting, loading and hauling. This ore is then crushed and transported via a 2 kilometre conveyor belt to a stockpile. The ore in the stockpile then enters a concentrator plant where it is processed through various stages of grinding and magnetic separation until a concentrated iron ore product is produced. This resulting concentrated iron ore is mixed with water to form a slurry that is pumped from the concentrator plant via a 100 km overland pipeline to the pelletising plant at Macquarie Harbour. At the pelletising plant, the concentrate is de-watered and formed into small balls that are heated in a furnace to over 1000 degrees Celsius for approximately ve hours. The pellets are then screened to remove excess material and transported by conveyor belt to a stockpile to cool. When a bulk carrier ship arrives at the loading facility, the cooled pellets are transported along the pier by conveyor belt to be loaded onto the ship. Apart from its mining leases in Western Tasmania, Penfolds Mining Group also holds, with anotherjoint venturer, a mining lease on land in north western Western Australia {termed the 'Upper West Project') where there are commercial quantities of magnetite. Currently the joint ventu rers are proceeding with the development ofthe mine site and processing facilities under a 'reduced expenditure' approach whilst another equity partner is sought to take a strategic share of the project. Despite the 'reduced expenditure' approach, the joint venturers have continued to build land tenure by negotiating with the traditional owners of the land, building road access and seeking access to build slurry pipelines and a desalination plant pipeline. Project engineering is also continuing with work being conducted to gain Commonwealth Government environmental approvals for the mine, pipelines and a desalination plant. Signicant groundwater reserves have been discovered that will aid in processing ore at the proposed mine site. Through one of its subsidiary companies and in a joint venture arrangement with another company, Penfolds Mining Group is also engaged in the Brisbane property market. It acquires land in highly sought-after inner-city locations and builds luxury residential apartments. 3|Page Penfolds Mining Group Lid Audit Case Study Ownership, Governance Structure and Organisation's Structure Penfolds Mining Group Led is a publicly listed company on the Australian Securities Exchange (ASX). It has approximately 1,200,000 shares on issue which are owned: 45% by Macau Steel Manufacturing Ltd (A Hong Kong registered company which operates several steel manufacturing sites throughout China 40% by Anglo Australian Industrial Mining Lid (A British registered company involved mining investment) The remaining 15% of shares are owned by other entities and individuals. Penfolds Mining Group Lid owns several subsidiary companies: Penfolds Iron Ore Mining Pty Ltd (100%) Penfolds Property Group Pty Ltd (100%) . . . Penfolds North Western Western Australia Mining Project Pty Ltd (100%) Penfolds Diamond Mine Pty Ltd (100%) The company has a highly experienced Board and management team, with particular expertise in the extractive industries, steel manufacture, and financial services. Currently there are five board members: Mrs Margaret Ling, Chairperson (extensive experience as a senior executive of several international mining companies) Mr Jeremiah Young, Non-executive director (currently an executive director of Macau Steel Manufacturing Ltd and extensive experience in company administration and human resource management with Macau Steel Manufacturing Ltd) Mr Hugh Stevens, Executive director (Chief Executive Officer and former director of Macau Steel Manufacturing Ltd) Mr Richard Temple, Non-executive director (extensive experience with finance, treasury and financial risk management across several Australian and multi-national organisations) Mr Christopher Price, Non-executive director (extensive experience with the technical aspects of mining and mining engineering across several large multi-national miners) The Board of the company has stated that it is committed to enhancing corporate governance and has adopted practices that are consistent with the ASX's Corporate Government Principles. It adheres to the majority of the ASX Best Practice Recommendations, with the exception of maintaining a separate internal audit function. The Board monitors the need for this function, taking into account the size, geographic location and complexity of the company's operations. Key management personnel 2 are paid a fixed salary plus a component of variable remuneration. The variable remuneration is based on incentives which are linked to the achievement of the company's annual operational targets, the individual's personal targets and certain long term company targets. These targets include: sales of ore product; operational budget outcomes, financial returns; development of mineral assets; mine The financial statements that are presented below are the consolidated financial statements for the group of companies and are prepared in accordance with Australian Accounting Standards. 2 Mr Hugh Stevens Chief Executive Officer, Mrs Claire Hewson Chie Financial Officer, Ms Gina Russell General Manager 4 PagePenfolds Mining Group Ltd Audit Case Study development; and downstream process improvement. The variable remuneration is paid in cash after the company's financial statements for that year have been audited and released publicly. The Entity's Selection and Application of Accounting Policies (Selected Only) and Other Matters Revenue Reoognition 0 Sales revenue is recognised on individual sales when control transfers to the customer. Generally, control passes, and sales revenue is recognised, when the iron ore is delivered to the ship on which it will be transported. However, there may be circumstances when judgement is required when recognising revenue. In such circumstances, a ve-step process is followed: identify the contract with a customer; identify the performance obligations in the contract; determine the transaction price; allocate the transaction price to the performance obligations; and recognise the revenue when the entity satises the performance obligations. o In a limited amount of sales, the company sells product where the company is responsible for shipping the iron ore to the customer {termed 'Cost and Freight'). In such circumstances the company has determined that the freight service is a separate performance obligation from the ore sale performance obligation. Therefore, the revenue for shipping services is recognised as the company satisfies this performance obligation over time rather than at the point when the iron ore is transferred to the ship. 0 The company has a right to payment at the point that control ofiron ore product passes to the customer. Inventories 0 Raw materials and stores, ore stockpiles, work in progress and finished goods are stated at the lower of cost and net realisable value. Cost is determined primarily on the basis of weighted average costs and comprises the cost of direct materials and the costs of production which include: 0 Labour cosls, materials and contractor costs which are directly attributable to the extraction and processing of ore; 0 Depreciation of property, plant and equipment used in the extraction and processing of ore; and 0 Production overheads directly attributable to the extraction and processing of ore. o Stockpiles represent ore that has been extracted and is available for further processing. If there is significant uncertainty as to when the stockpiled ore will be processed it is expensed as incurred. Where the future processing of the ore can be predicted with condence because it exceeds the mine's cut-off grade, it is valued at the lower of cost and net realisable value. Work in progress inventoryincludes partly processed material. Quantities are assessed primarily through surveys and assays. Provision for Decommissioning and Restoration Decommissioning and restoration provisions include the dismantling and demolition of infrastructure and the removal of residual materials and remediation of disturbed areas. The provision is recognised in the accounting period when the obligation arising from the related disturbance occurs, whether this occurs during the mine development or during the 5|Page Penfolds Mining Group Ltd Audit Case Study production phase, based on the net present value of estimated future costs. The costs are estimated on the basis ofa disclosure plan. The cost estimates are calculated annually during the life of the operation to reflect known developments and are subject to formal review at regular intervals. Financial Risk Management Foreign exchange risk the company operates internationally and is exposed to foreign exchange risk arising from various currency exposures, primarily with respect to the US dollar. This risk arises from commercial transactions given that the company's sales revenues are denominated in US dollars and the majority of its operating costs are denominated in Australian dollars and certain assets and liabilities are denominated in a currency which is not the company's functional currency. The following table shows assets and liabilities held or owed in US dollars at the respective balance date, but translated to Australian dollars using relevant exchange rates: 2020 2019 $000 $000 Cash and cash equivalents 99,117 43,104 Trade and other receivables 78,694 29,848 Trade and other payables (12S) (73) Price risk the company is exposed to commodity price risk. During current and prior years, the price of iron ore pellets is based on a price index used in the market. Currently the company does not manage its iron ore price risk with any financial instruments. Exploration and Evaluation Exploration and evaluation expenditure consist of costs that are directly attributable to: research into mine sites; conducting geological studies; exploratory drilling and sampling; testing extraction and treatment methods; and conducing feasibility studies. This expenditure also includes costs incurred in acquiring mining rights and amounts payable to third parties to acquire interests in projects and access to areas of interest. Exploration and evaluation expenditure is charged against prot and loss as incurred, except for expenditure incurred after a decision to proceed to development is made. In these cases, the expenditure is capitalised as an asset. The company charges exploration and evaluation expenditure to earnings as and when incurred. However, once the decision to develop the area of interest is made or acquisitions costs are incurred the expenditure is capitalised as an asset. As a result, a signicant amount of expenditure incurred on the development of the new ore pit in the Frenchman's Cap region has been capitalised {see mine properties and development on the balance sheet). Mine Properties and Development Mine properties and development (see balance sheet) represent the accumulation of all exploration, evaluation and development expenditure incurred by the company in relation to areas of mining interest in which mining of a mineral resource has commenced. 5|Page Penfolds Mining Group Led Audit Case Study Costs on these producing properties are amortised over the life of the particular mine site to which such costs relate on the production output basis. The carrying value of each mine property and development are assessed annually for impairment (see below). Impairment of Assets In accordance with AASB 136 Impairment of Assets, at each reporting date the company assess whether there is any indication that an asset, including capitalised development expenditure, may be impaired. Where an indicator of impairment exists, the company makes a formal estimate of the recoverable amount. Where the carrying amount of an asset exceeds its recoverable amount, the asset is considered to be impaired and is written down to its recoverable amount. Impairment losses are recognised in the income statement. Some Economic and Industry Factors Iron Ore Market Globally3 Australia, Brazil, India, China and Russia are the five largest producers of iron ore globally, but it is generally accepted that Brazil is a major competitor for Australia in terms of iron ore production. Although there were some concerns that Chinese imports of iron ore would fall given COVID-19 effects, Chinese government stimulus packages seem to have encouraged steel production and therefore iron prices have been relatively strong compared to other commodities. This, coupled with a major mine issue in Brazil, has meant that Australian iron ore exports have also been relatively strong. Key markets The key geographic markets for Penfolds Mining Group Led are China, Australia, and in the past Korea. The main revenue is from iron ore sales, but there had been some domestic sales in property in 2020. The following table shows the main geographic area sales and products: 2020 2019 $000 $000 Iron ore sales Australia 41,667 24,704 China 469,318 313,738 Korea 30,159 Property sales Australia 15,339 26,324 368,601 Trade disputes As noted above, the key market currently for the iron ore product of Penfolds Mining Group Ltd is China. Although there is yet to be any adverse action taken against Australian iron ore exports, the Chinese government has imposed trade sanctions on Australian exports of barley, 3 https://www.prnewswire.comews-releases/global-iron-ore-mining-markets-report-2018-2022-featuring-leading-players-vale-rio- into-anglo-american-plc-bhp-billiton--fortescue-metals-group-300780869.html 7 | PagePenfolds Mining Group Ltd Audit Case Study beef and lamb, wine, cotton, lobsters, timber, and coal*. Although alternate export markets have been found for most of these products, volatility still exists in the relationship between Australia and China, which may be further exacerbated when Australian exporters of barley pursue action at the World Trade Organisation. COVID-19 Penfolds Mining Group Lid has been able to maintain full production during COVID-19 because of strong work plans and controls and attention to the health and well-being of employees. Despite this, the situation is not clear with respect to: COVID-19 related supply chain issues (e.g. national lockdowns in other countries hampering sea supply chains); and COVID-19 related manufacturing issues (e.g. national lockdowns in customer countries hampering steel production). However, national vaccination programs in other countries may mitigate these issues. Other Factors . During 2020 1,100,000 dry metric tonnes (DMT) of iron ore was sold to Macau Steel Manufacturing Ltd (2019 - 852,489 DMT). This represented $182,147,000 of revenue in 2020 (2019 - $131,600,000). At 31 December 2020 the trade receivables balance included an amount owing by Macau Steel Manufacturing Ltd of $32,350,000 (denominated in US dollars, but translated to Australian dollars (2019 - $2,900,000). Most of Penfolds Mining Group Ltd's export sales are conducted in United States dollars, so the company is exposed to fluctuations in exchange rates. The Australian dollar fluctuated significantly against the US$ in the 2020 year. As noted above, some of the receivables related to these sales are also denominated in US dollars. Some key revenue information: 2020 2019 Iron ore pellet sales (dry metric tonne) 2,376,029 2,096,673 Iron ore concentrate sales (dry metric tonne) 122 Iron ore chip sales (dry metric tonne) 113,611 95,921 Total iron ore product sales (dry metric tonne) 2,489,640 2,192,086 Average realised product price (USS/tonne, Free on Board (FOB) Macquarie Harbour) 136.85 109.95 Average realised exchange rate (AUD to USD) 0.6955 0.6944 Average realised product price (AS/tonne, FOB Macquarie Harbour) 196.77 158.33 Key Stakeholder Influences . One of the directors, Mr Jeremiah Young, is an executive director of a major shareholder and major customer of Penfolds Mining Group Ltd. Mr Hugh Stevens CEO, Mrs Claire Hewson CFO, Ms Gina Russell General Manager are three key executive officers of the company. Their continuation with the company is critical to its future direction. As noted above, to retain their services, the company https://www.abc.net.auews/2020-12-17/australian-trade-tension-sanctions-china-growing-commodities/12984218 8 | PagePenfolds Mining Group Ltd Audit Case Study provides them with a component of variable remuneration which is based on incentives linked to operational performance and long term strategic performance. These incentives are paid in cash (after nancial statements have been audited and released publicly). 0 One customer, Macau Steel Manufacturing Ltd (who is also a major shareholder}, accounts for approximately 35% of Penfolds Mining Group Ltd's total sales of iron ore product. Financial Information The income statements and balance sheets for 2020, 2019 and 2018 are shown below: Penfolds Mining Group Ltd Audit Case Study Consolidated Statement of Comprehensive Income For the year ended 31 December 2020 2020 2019 2018 $000 $000 $000 Revenue from operations 526,324 368,601 368,204 Cost of sales (295,506) (286,072) (238,938) Gross profit 230,818 82,529 129,266 Administration expenses 5,218) (5,949) (5,177) Operating profit before other income 225,600 76,580 124,089 Exploration and evaluation expenditure (1,414) (1,235) (822) Other income 386 174 281 Operating profit before finance costs 224,572 75,519 123,548 Finance income 5,344 7,991 13,648 Finance expenses (21,037) (1,884) (1,868) Profit before income tax expense 208,879 31,626 135,328 Income tax expense 5,693) (4,292) (22,390) Profit for the year 203,186 77,334 112,938 Total comprehensive (loss)/income for the year 203,186 77,334 112,938 Total comprehensive income/(loss) for the period attributable to: Owners of the parent 204,179 77,661 112,938 Non Controlling Interests 993) 327) (387) 203,186 77,334 112,551 Total comprehensive (loss)/income attributable to: Owners of the parent 203,186 77,334 112,551 203,186 77,334 112,551Penfolds Mining Group Led Audit Case Study Cost of sales information for 2020 and 20195: 2020 2019 $000 $000 Cost of sales - mining Mining costs 139,992 133,656 Production costs 114,971 107,960 Changes in inventories (11,010) (32,443) Mining and production costs 243,953 209,173 Freight costs 21,103 21,533 Government royalties 19,646 9,511 Depreciation and amortisation expense 21,056 21,991 Mine properties and development capitalised during the year 0 (14,525) - amortisation expense 7,035 6,659 Deferred stripping capitalised during the year (69,308) (3,989) - amortisation expense 31,127 35,832 Foreign exchange gain / (loss) 4,554 (113) Total cost of sales - mining 279,166 286,072 Cost of sales - property development Property costs 13,771 Inventory provision 2,569 Total cost of sales - property development 16,340 Total cost of sales 295,506 286,072 In the cost of sales information is an item denoted 'deferred stripping'. Stripping is the cost involved in removing top soil and other waste ore material in order to gain access to the actual iron ore seam. 11 | PagePenfolds Mining Group Ltd Audit Case Study Consolidated Statement of Financial Position As at 31 December 2020 2020 2019 2018 Assets $000 $000 $000 Current Assets Cash and cash equivalents 183,385 142,143 204,497 Trade and other receivables 94,469 58,80 31,715 Inventories 123,010 119,801 50,730 Other financial assets 19,539 19,783 19,734 Total current assets 420,403 340,536 316,676 Non-current Assets Receivables 8,484 8,470 8,654 Non-current inventories 222 Property, plant and equipment 113,994 37,756 77,345 Right of Use Assets 2,31 2,883 Mine properties and development 269,297 206,321 193,302 Deferred tax assets 59,291 32,855 12,416 Total non-current assets 453,377 348,285 291,939 Total assets 873,780 688,821 608,615 Liabilities Current Liabilities Lease liability 1,109 839 Trade and other payables 39,879 51,258 45,116 Borrowings 14,044 16,755 7,126 Provisions 24,584 22,854 20,168 Other financial liabilities 3,890 944 Total current liabilities 83,506 92,650 72,410 Non-current Liabilities Borrowings 611 Lease liability 1,299 2,084 Provisions 72,616 62,034 57,764 Other financial liabilities 4,268 Total non-current liabilities 78,183 64,118 58,375 Total liabilities 161,689 156,768 130,785 Net Assets 712,091 532,053 177,830 Equity Contributed equity 331,513 331,513 831,513 Retained earnings 381,747 200,716 146,243 Captial and reserves attributable to owners of Penfolds Mining Ltd 713,260 532,229 477,756 Non-Controlling Interests (1,169) (176) 74 Total Equity 712,091 532,053 477,830 Additional Information *Penfolds Mining Group Led has several local and overseas bank accounts. The overseas bank accounts, used to deposit receipts from overseas customers are in US dollars. The company accountant uses the exchange rate at the close of the last business day in the financial year to convert the bank accounts in foreign currency to the equivalent A$ value at the year end. 12 | PagePenfolds Mining Group Ltd Audit Case Study Other S & H Partners is an Australian accounting firm with offices located in each of the major cities. The firm has just been appointed to conduct the 31 December 2020 audit for Penfolds Mining Group Ltd. Appropriate client acceptance and quality assurance procedures under Australian Auditing Standards have been conducted by S & H Partners for the audit of Penfolds Mining Group Ltd. You are employed by S & H Partners and the team that you are a member of has been assigned, by the audit partner, a number of tasks to complete in the audit of Penfolds Mining Group Ltd for the year ended 31 December 2020.Task 3 For each significant financial statement account assertion, the inherent risk and control risk are assessed. The work performed around understanding the business provides the inherent risk assessment, while the results of any control testing provides the control risk assessment. The combination of these two risks can be known as overall risk assessment (ORA). The inverse of the ORA determines the detection risk DR. That is, the nature, timing and extent of the substantive procedures to be performed -the detection risk to be mitigated by auditors. The detection risk, DR can be determined using the following table: Control Risk High Medium Low High Lowest Lower Medium Inherent Medium Lower Medium Higher Risk Low Medium High Highest For example, if the IR is assessed as High and the CR is assessed as High, this means that the ORA is High and therefore using the blue area in the diagram above, the DR is lowest. Note, there is an inverse relationship between ORA and DR. Please also watch the video instructions on this task from the partner. Required Spreadsheet tab Task 3 identifies six financial statement accounts and related assertions assessed as being at risk for Penfolds Mining Group Lid. Note that the control risk for these accounts/assertions has already been assessed by other members of the audit engagement team as indicated in spreadsheet tab Task 3 a. From the information that you have available to you about Penfolds Mining Group Lid, assess the inherent risk for each of these six account/assertions (high, medium or low) b. Justify your assessment of the inherent risk level for each of the six account/assertions. C. Applying the qualitative audit risk model described above, determine overall risk assessment for each account/assertion and then determine the acceptable level of detection risk
Step by Step Solution
There are 3 Steps involved in it

Get step-by-step solutions from verified subject matter experts