

Question: pepsico ratio analysis i will provide the worksheet that needs to be done and an example for Gross Profit Margin Ratio for starbucks but i
pepsico ratio analysis
i will provide the worksheet that needs to be done and an example for Gross Profit Margin Ratio for starbucks but i need the same for pepsico and will provide the numbers needed.
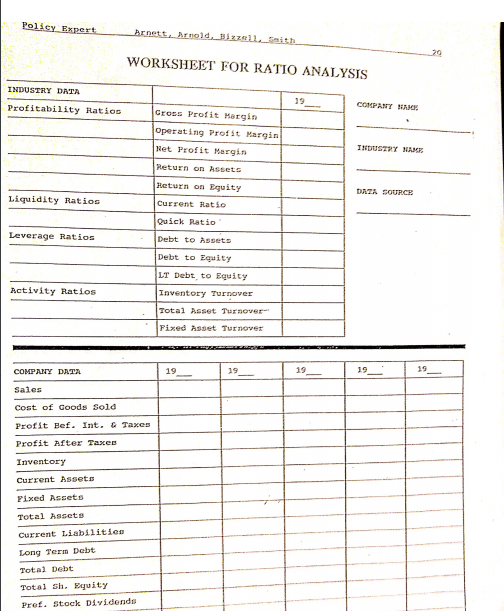
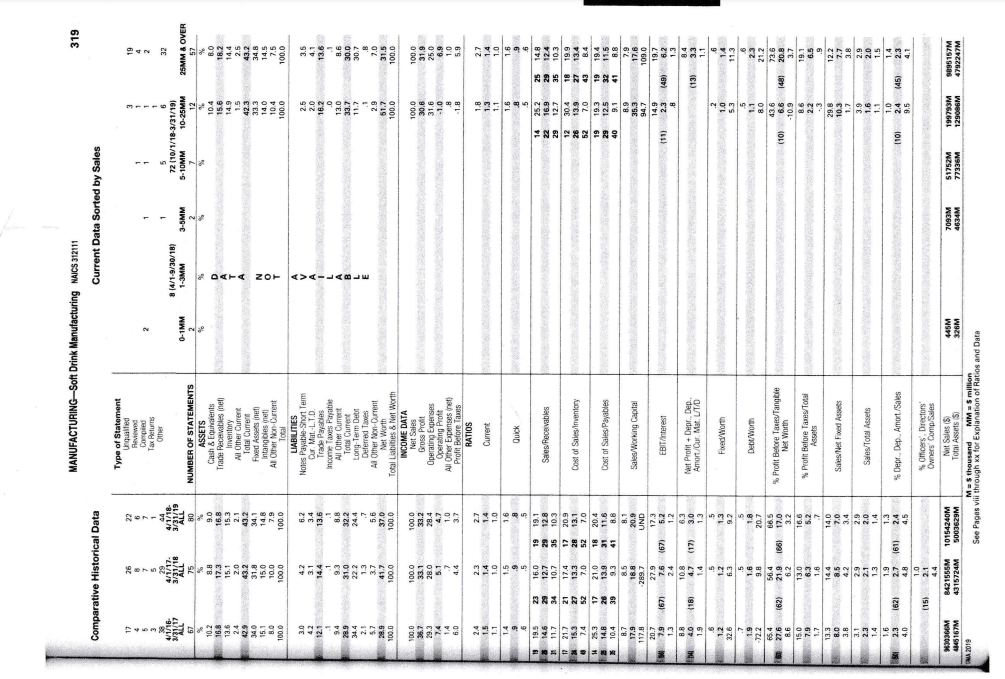
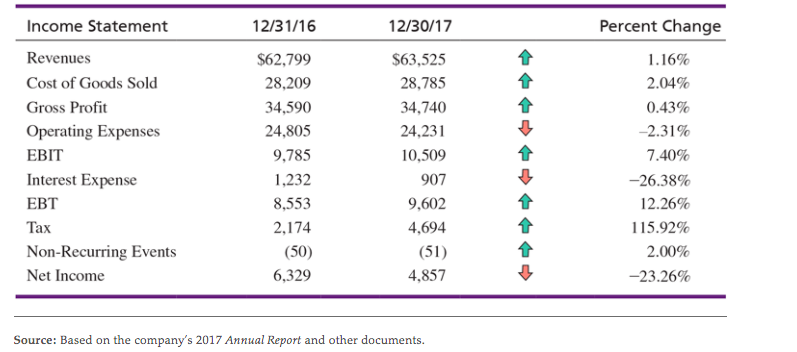
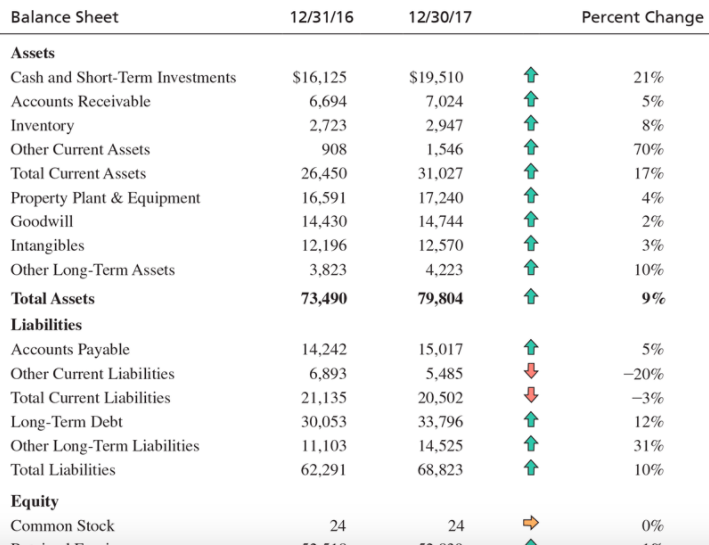

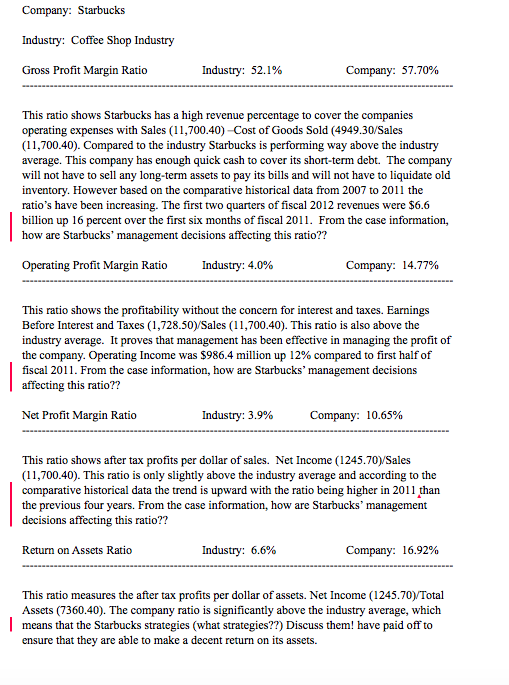
Policy_Foxpert Arnett. Arnold Bizei_nish 20 WORKSHEET FOR RATIO ANALYSIS INDUSTRY DATA COMPATTO Profitability Ratios Cross Profit margin Operating Profit Margin Net Profit Mergin INDUSTRY NICE Return on Assets Return on Equity DATA SOURCE Liquidity Ratios Current Ratio Quick Ratio Leverage Ratios Debt to Assets Debt to Equity Activity Ratios LT Debt to Equity Inventory Turnover Total Asset Turnover- Fixed Asset Turnover COMPANY DATA 19 39 19 19 Sales Cost of Goods Sold Profit Bef. Int. Taxes Profit After Taxes Inventory Current Assets Pixed Assets Total Assets Current Liabilities Long Term Debt Total Debt Total sh. Equity Prof. Stock Dividends MANUFACTURING-Soft Drink Manufacturing NAICS 312111 319 Comparative Historical Data Current Data Sorted by Sales NON 1-3MM NOW = = = OCE ZO 88 ci MDF-PC X2 RE 37,0 100.0 mo 88 SMR GO ON = = = = WW=W= 167 491 117.8289.7 791671 88108 140 (18) 47 (17) 6 32.6 30 27.6 (62) 8.6 6.3 5.2 16 2.31621 27 161124 431524M 9AZ SOM 326M WEGLE 4702347M 12/31/16 Income Statement Revenues Cost of Goods Sold Gross Profit Operating Expenses EBIT Interest Expense EBT Tax Non-Recurring Events Net Income $62,799 28,209 34,590 24,805 9,785 1,232 8,553 2,174 (50) 6,329 12/30/17 $63,525 28,785 34,740 24,231 10,509 907 9,602 4,694 (51) 4,857 Percent Change 1.16% 2.04% 0.43% -2.31% 7.40% -26.38% 12.26% 115.92% 2.00% -23.26% Source: Based on the company's 2017 Annual Report and other documents. Balance Sheet 12/31/16 12/30/17 Percent Change t + $16,125 6,694 2,723 908 26,450 16,591 14,430 12.196 3,823 73,490 Assets Cash and Short-Term Investments Accounts Receivable Inventory Other Current Assets Total Current Assets Property Plant & Equipment Goodwill Intangibles Other Long-Term Assets Total Assets Liabilities Accounts Payable Other Current Liabilities Total Current Liabilities Long-Term Debt Other Long-Term Liabilities Total Liabilities Equity Common Stock $19,510 7,024 2,947 1,546 31,027 17,240 14,744 12,570 4,223 79,804 21% 5% 8% 70% 17% 4% 2% 3% 10% + 9% 14,242 6,893 21,135 30,053 11,103 62,291 15,017 5,485 20,502 33,796 14,525 68,823 5% -20% -3% 12% 31% 10% 1 24 24 1 0% 24 24 Common Stock Retained Earnings Treasury Stock Paid in Capital & Other Total Equity Total Liabilities and Equity 52,518 (31,468) (9,875) 11,199 73,490 52,839 (32,757) (9,125) 10,981 79,804 0% 1% 4% -8% -2% 9% Company: Starbucks Industry: Coffee Shop Industry Gross Profit Margin Ratio Industry: 52.1% Company: 57.70% This ratio shows Starbucks has a high revenue percentage to cover the companies operating expenses with Sales (11,700.40) Cost of Goods Sold (4949.30/Sales (11,700.40). Compared to the industry Starbucks is performing way above the industry average. This company has enough quick cash to cover its short-term debt. The company will not have to sell any long-term assets to pay its bills and will not have to liquidate old inventory. However based on the comparative historical data from 2007 to 2011 the ratio's have been increasing. The first two quarters of fiscal 2012 revenues were $6.6 billion up 16 percent over the first six months of fiscal 2011. From the case information, how are Starbucks' management decisions affecting this ratio?? Operating Profit Margin Ratio Industry: 4.0% Company: 14.77% This ratio shows the profitability without the concern for interest and taxes. Earnings Before Interest and Taxes (1,728.50)/Sales (11,700.40). This ratio is also above the industry average. It proves that management has been effective in managing the profit of the company. Operating Income was $986.4 million up 12% compared to first half of fiscal 2011. From the case information, how are Starbucks management decisions affecting this ratio?? Net Profit Margin Ratio Industry: 3.9% Company: 10.65% This ratio shows after tax profits per dollar of sales. Net Income (1245.70y/Sales (11,700.40). This ratio is only slightly above the industry average and according to the comparative historical data the trend is upward with the ratio being higher in 2011 than the previous four years. From the case information, how are Starbucks' management decisions affecting this ratio?? Return on Assets Ratio Industry: 6.6% Company: 16.92% This ratio measures the after tax profits per dollar of assets. Net Income (1245.70y/Total Assets (7360.40). The company ratio is significantly above the industry average, which | means that the Starbucks strategies (what strategies??) Discuss them! have paid off to ensure that they are able to make a decent return on its assets. Policy_Foxpert Arnett. Arnold Bizei_nish 20 WORKSHEET FOR RATIO ANALYSIS INDUSTRY DATA COMPATTO Profitability Ratios Cross Profit margin Operating Profit Margin Net Profit Mergin INDUSTRY NICE Return on Assets Return on Equity DATA SOURCE Liquidity Ratios Current Ratio Quick Ratio Leverage Ratios Debt to Assets Debt to Equity Activity Ratios LT Debt to Equity Inventory Turnover Total Asset Turnover- Fixed Asset Turnover COMPANY DATA 19 39 19 19 Sales Cost of Goods Sold Profit Bef. Int. Taxes Profit After Taxes Inventory Current Assets Pixed Assets Total Assets Current Liabilities Long Term Debt Total Debt Total sh. Equity Prof. Stock Dividends MANUFACTURING-Soft Drink Manufacturing NAICS 312111 319 Comparative Historical Data Current Data Sorted by Sales NON 1-3MM NOW = = = OCE ZO 88 ci MDF-PC X2 RE 37,0 100.0 mo 88 SMR GO ON = = = = WW=W= 167 491 117.8289.7 791671 88108 140 (18) 47 (17) 6 32.6 30 27.6 (62) 8.6 6.3 5.2 16 2.31621 27 161124 431524M 9AZ SOM 326M WEGLE 4702347M 12/31/16 Income Statement Revenues Cost of Goods Sold Gross Profit Operating Expenses EBIT Interest Expense EBT Tax Non-Recurring Events Net Income $62,799 28,209 34,590 24,805 9,785 1,232 8,553 2,174 (50) 6,329 12/30/17 $63,525 28,785 34,740 24,231 10,509 907 9,602 4,694 (51) 4,857 Percent Change 1.16% 2.04% 0.43% -2.31% 7.40% -26.38% 12.26% 115.92% 2.00% -23.26% Source: Based on the company's 2017 Annual Report and other documents. Balance Sheet 12/31/16 12/30/17 Percent Change t + $16,125 6,694 2,723 908 26,450 16,591 14,430 12.196 3,823 73,490 Assets Cash and Short-Term Investments Accounts Receivable Inventory Other Current Assets Total Current Assets Property Plant & Equipment Goodwill Intangibles Other Long-Term Assets Total Assets Liabilities Accounts Payable Other Current Liabilities Total Current Liabilities Long-Term Debt Other Long-Term Liabilities Total Liabilities Equity Common Stock $19,510 7,024 2,947 1,546 31,027 17,240 14,744 12,570 4,223 79,804 21% 5% 8% 70% 17% 4% 2% 3% 10% + 9% 14,242 6,893 21,135 30,053 11,103 62,291 15,017 5,485 20,502 33,796 14,525 68,823 5% -20% -3% 12% 31% 10% 1 24 24 1 0% 24 24 Common Stock Retained Earnings Treasury Stock Paid in Capital & Other Total Equity Total Liabilities and Equity 52,518 (31,468) (9,875) 11,199 73,490 52,839 (32,757) (9,125) 10,981 79,804 0% 1% 4% -8% -2% 9% Company: Starbucks Industry: Coffee Shop Industry Gross Profit Margin Ratio Industry: 52.1% Company: 57.70% This ratio shows Starbucks has a high revenue percentage to cover the companies operating expenses with Sales (11,700.40) Cost of Goods Sold (4949.30/Sales (11,700.40). Compared to the industry Starbucks is performing way above the industry average. This company has enough quick cash to cover its short-term debt. The company will not have to sell any long-term assets to pay its bills and will not have to liquidate old inventory. However based on the comparative historical data from 2007 to 2011 the ratio's have been increasing. The first two quarters of fiscal 2012 revenues were $6.6 billion up 16 percent over the first six months of fiscal 2011. From the case information, how are Starbucks' management decisions affecting this ratio?? Operating Profit Margin Ratio Industry: 4.0% Company: 14.77% This ratio shows the profitability without the concern for interest and taxes. Earnings Before Interest and Taxes (1,728.50)/Sales (11,700.40). This ratio is also above the industry average. It proves that management has been effective in managing the profit of the company. Operating Income was $986.4 million up 12% compared to first half of fiscal 2011. From the case information, how are Starbucks management decisions affecting this ratio?? Net Profit Margin Ratio Industry: 3.9% Company: 10.65% This ratio shows after tax profits per dollar of sales. Net Income (1245.70y/Sales (11,700.40). This ratio is only slightly above the industry average and according to the comparative historical data the trend is upward with the ratio being higher in 2011 than the previous four years. From the case information, how are Starbucks' management decisions affecting this ratio?? Return on Assets Ratio Industry: 6.6% Company: 16.92% This ratio measures the after tax profits per dollar of assets. Net Income (1245.70y/Total Assets (7360.40). The company ratio is significantly above the industry average, which | means that the Starbucks strategies (what strategies??) Discuss them! have paid off to ensure that they are able to make a decent return on its assets
Step by Step Solution
There are 3 Steps involved in it

Get step-by-step solutions from verified subject matter experts