

Question: Perform a full competitive analysis for Company B strategy, the competitiveness of a company's prices and costs, and evaluating the strengths and of a company's
Perform a full competitive analysis for Company B strategy, the competitiveness of a company's prices and costs, and evaluating the strengths and of a company's closest competitors. Please be clear and detailed. Thank you.
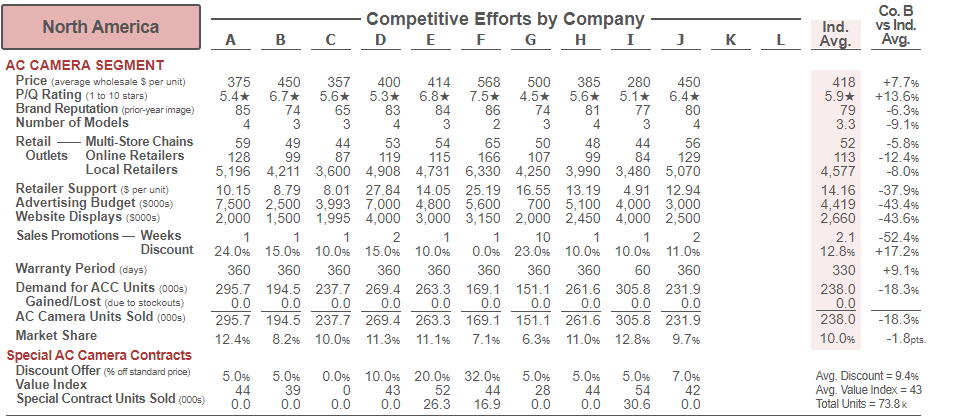
North America Competitive Efforts by Company F G H Ind. Co.B vs Ind. Avg. A B C D E I J K L Avg. 418 7.5* 5.9* 79 3.3 52 113 +7.7% 13.6% -6.3% -9.1% -5.8% -12.4% -8.0% 4,577 14.16 -37.9% 375 450 357 400 414 568 500 385 280 450 5.4* 6.7* 5.6* 5.3* 6.8* 4.5* 5.6* 5.1* 6.4* 85 74 65 83 84 86 74 81 77 80 4 3 3 4 3 2 3 4 3 4 59 49 44 53 54 65 50 48 44 56 128 99 87 119 115 166 107 99 84 129 5,196 4,211 3,600 4,908 4,731 6,330 4.250 3,990 3,480 5,070 10.15 8.79 8.01 27.84 14.05 25.19 16.55 13.19 4.91 12.94 7,500 2,500 3,993 7,000 4,800 5,600 700 5,100 4,000 3,000 2,000 1,500 4,000 3,000 3,150 2,000 2.450 4,000 2,500 2 10 2 24.0% 15.0% 10.0% 15.09 10.09 0.0% 23.0% 100% 10.0% 11.0% 360 360 360 360 360 360 360 360 60 360 295.7 194.5 237.7 269.4 263.3 169.1 151.1 261.6 305.8 231.9 0.0 0.0 0.0 0.0 0.0 0.0 0.0 0.0 0.0 0.0 295.7 194.5 237.7 269.4 263.3 169.1 151.1 261.6 305.8 231.9 12.4% 8.2% 100% 11.3% 11.1% 7.196 6.3% 11.0% 12.8% 9.7% 4,419 1,995 AC CAMERA SEGMENT Price (average wholesale per unit) PIQ Rating (1 to 10 stars) Brand Reputation (prior-year image) Number of Models Retail Multi-Store Chains Outlets Online Retailers Local Retailers Retailer Supports per unit Advertising Budget (5000s) Website Displays (5000s) Sales Promotions - Weeks Discount Warranty Period (days) Demand for ACC Units (000s) Gained/Lost (due to stockouts) AC Camera Units Sold (000s) Market Share Special AC Camera Contracts Discount Offer (% off standard price) Value Index Special Contract Units Sold (0005) 2,660 2.1 12.89 -43.4% -43.6% -52.4% +17.2% +9.1% -18.3% 330 238.0 0.0 238.0 10.0% -18.3% -1. Spts 5.0% 44 0.0 5.0% 39 0.0 0.0% 10.0% 20.0% 32.0% 0 43 52 44 0.0 0.0 26.3 16.9 5.0% 28 0.0 5.0% 44 0.0 5.0% 54 30.6 7.0% 42 0.0 Avg. Discount = 9.4% Avg. Value Index = 43 Total Units = 73.8k North America Competitive Efforts by Company F G H Ind. Co.B vs Ind. Avg. A B C D E I J K L Avg. 418 7.5* 5.9* 79 3.3 52 113 +7.7% 13.6% -6.3% -9.1% -5.8% -12.4% -8.0% 4,577 14.16 -37.9% 375 450 357 400 414 568 500 385 280 450 5.4* 6.7* 5.6* 5.3* 6.8* 4.5* 5.6* 5.1* 6.4* 85 74 65 83 84 86 74 81 77 80 4 3 3 4 3 2 3 4 3 4 59 49 44 53 54 65 50 48 44 56 128 99 87 119 115 166 107 99 84 129 5,196 4,211 3,600 4,908 4,731 6,330 4.250 3,990 3,480 5,070 10.15 8.79 8.01 27.84 14.05 25.19 16.55 13.19 4.91 12.94 7,500 2,500 3,993 7,000 4,800 5,600 700 5,100 4,000 3,000 2,000 1,500 4,000 3,000 3,150 2,000 2.450 4,000 2,500 2 10 2 24.0% 15.0% 10.0% 15.09 10.09 0.0% 23.0% 100% 10.0% 11.0% 360 360 360 360 360 360 360 360 60 360 295.7 194.5 237.7 269.4 263.3 169.1 151.1 261.6 305.8 231.9 0.0 0.0 0.0 0.0 0.0 0.0 0.0 0.0 0.0 0.0 295.7 194.5 237.7 269.4 263.3 169.1 151.1 261.6 305.8 231.9 12.4% 8.2% 100% 11.3% 11.1% 7.196 6.3% 11.0% 12.8% 9.7% 4,419 1,995 AC CAMERA SEGMENT Price (average wholesale per unit) PIQ Rating (1 to 10 stars) Brand Reputation (prior-year image) Number of Models Retail Multi-Store Chains Outlets Online Retailers Local Retailers Retailer Supports per unit Advertising Budget (5000s) Website Displays (5000s) Sales Promotions - Weeks Discount Warranty Period (days) Demand for ACC Units (000s) Gained/Lost (due to stockouts) AC Camera Units Sold (000s) Market Share Special AC Camera Contracts Discount Offer (% off standard price) Value Index Special Contract Units Sold (0005) 2,660 2.1 12.89 -43.4% -43.6% -52.4% +17.2% +9.1% -18.3% 330 238.0 0.0 238.0 10.0% -18.3% -1. Spts 5.0% 44 0.0 5.0% 39 0.0 0.0% 10.0% 20.0% 32.0% 0 43 52 44 0.0 0.0 26.3 16.9 5.0% 28 0.0 5.0% 44 0.0 5.0% 54 30.6 7.0% 42 0.0 Avg. Discount = 9.4% Avg. Value Index = 43 Total Units = 73.8k
Step by Step Solution
There are 3 Steps involved in it

Get step-by-step solutions from verified subject matter experts