

Question: Perform a horizontal analysis for Under Armour for the years 2020, 2019, 2018, and 2017. Also find the AR Turnover for all years and Inventory
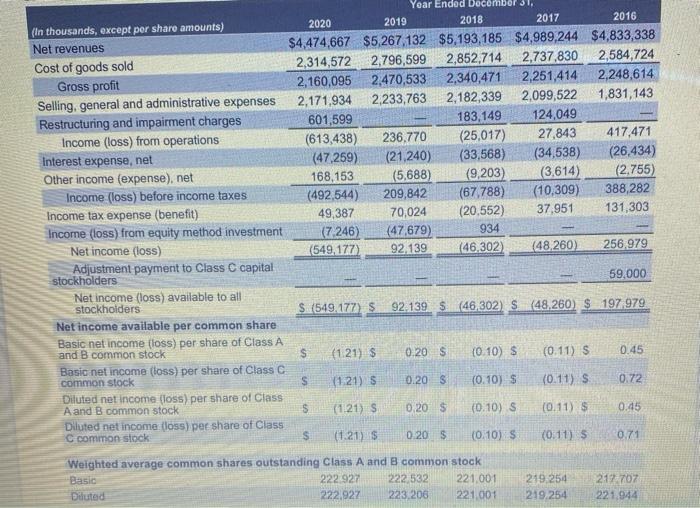
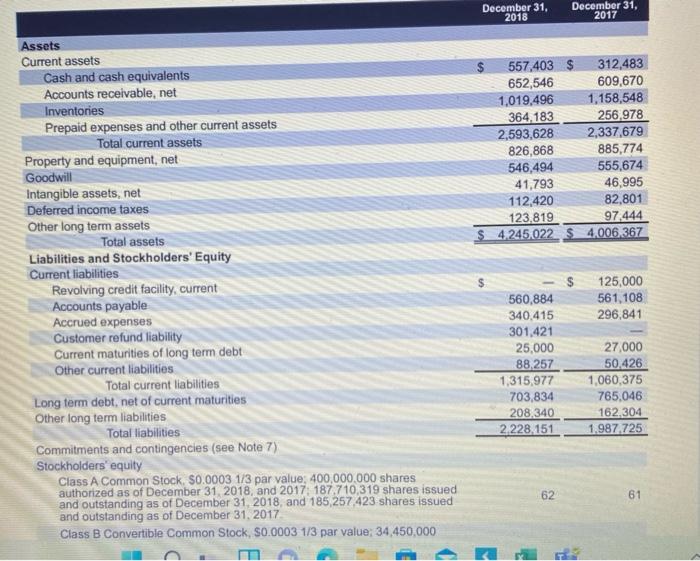
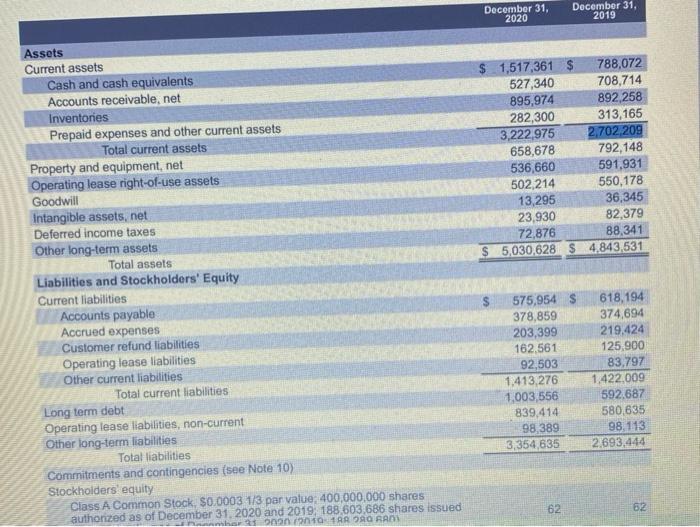
Year Ended December 31, 2020 2019 2018 2017 2016 (In thousands, except per share amounts) Net revenues $4,474,667 $5,267,132 $5,193,185 $4,989,244 $4,833,338 Cost of goods sold 2,314,572 2,796,599 2,852,714 2,737,830 2,584,724 Gross profit 2,160,095 2,470,533 2,340,471 2,251,414 2,248,614 Selling, general and administrative expenses 2,171,934 2,233,763 2,182,339 2,099,522 1,831,143 Restructuring and impairment charges 601,599 183,149 124,049 Income (loss) from operations (613,438) 236,770 (25,017) 27,843 417,471 Interest expense, net (47,259) (21,240) (33,568) (34,538) (26,434) Other income (expense), net 168,153 (5.688) (9,203) (3,614) (2.755) Income (loss) before income taxes (492,544) 209,842 (67 788) (10.309) 388,282 Income tax expense (benefit) 49,387 70,024 (20,552) 37.951 131,303 Income (loss) from equity method investment (7.246) (47,679) 934 Net income (loss) (549.177 92,139 (46.302 (48,260) 256.979 Adjustment payment to Class C capital stockholders 59,000 Net income (loss) available to all stockholders $(549.177) $ 92.139 $ 46,302) S (48,260) $ 197 979 Net income available per common share Basic net income (loss) per share of Class A and B common stock S (1.21) $ 0.20 S (0.10) $ (0.11) S 0.45 Basic net income (loss) per share of Class C common stock S 1.21) 5 0.20 S (0.10) S (0.11) $ 0.72 Diluted net income foss) per share of Class A and B common stock S (121) S 0,20 $ (0.10) S (0.11) $ 0.45 Diluted net income (loss) per share of Class C common stock S (1.21) $ 0.20 S (0.10) $ (0.11) $ 0.71 Weighted average common shares outstanding Class A and B common stock Basic 222 927 222,532 221001 219.254 2:17.707 Diluted 222,927 223,206 221.001 219.254 221,944 December 31, 2018 December 31, 2017 557,403 $ 312,483 652,546 609,670 1,019,496 1,158,548 364,183 256,978 2,593,628 2,337,679 826,868 885,774 546,494 555,674 41,793 46,995 112,420 82,801 123,819 97 444 $ 4245022 $ 4,006,367 Assets Current assets Cash and cash equivalents Accounts receivable, net Inventories Prepaid expenses and other current assets Total current assets Property and equipment, net Goodwill Intangible assets, net Deferred income taxes Other long term assets Total assets Liabilities and Stockholders' Equity Current liabilities Revolving credit facility, current Accounts payable Accrued expenses Customer refund liability Current maturities of long term debt Other current liabilities Total current liabilities Long term debt, net of current maturities Other long term liabilities Total liabilities Commitments and contingencies (see Note 7) Stockholders' equity Class A Common Stock. $0.0003 1/3 par value: 400,000,000 shares authorized as of December 31 2018, and 2017 187,710,319 shares issued and outstanding as of December 31, 2018, and 185,257,423 shares issued and outstanding as of December 31, 2017 Class B Convertible Common Stock, S0.0003 1/3 par value; 34,450,000 125,000 561,108 296,841 560,884 340.415 301,421 25,000 88,257 1,315,977 703,834 208,340 2.228.151 27,000 50.426 1,060,375 765.046 162,304 1.987 725 62 61 December 31, 2020 December 31, 2019 $ 1,517,361 $ 788,072 527,340 708,714 895,974 892,258 282,300 313,165 3,222,975 2,702 209 658,678 792,148 536,660 591,931 502,214 550,178 13,295 36,345 23,930 82,379 72,876 88,341 $ 5,030,628 $ 4.843,531 Assets Current assets Cash and cash equivalents Accounts receivable, net Inventories Prepaid expenses and other current assets Total current assets Property and equipment, net Operating lease right-of-use assets Goodwill Intangible assets, net Deferred income taxes Other long-term assets Total assets Liabilities and Stockholders' Equity Current liabilities Accounts payable Accrued expenses Customer refund liabilities Operating lease llabilities Other current liabilities Total current liabilities Long term debt Operating lease liabilities, non-current Other long-term liabilities Total liabilities Commitments and contingencies (see Note 10) Stockholders equity Class A Common Stock. $0.0003 1/3 par value, 400,000,000 shares authorized as of December 31, 2020 and 2019, 188,603 686 shares issued on 1911RRA RAS $ 575,954 $ 378,859 203,399 162.561 92,503 1.413,276 1,003,556 839,414 98,389 3,354,635 618,194 374,694 219,424 125.900 83,797 1,422,009 592.687 580.635 98,113 2.693,444 62 52
Step by Step Solution
There are 3 Steps involved in it

Get step-by-step solutions from verified subject matter experts