

Question: Perform a Horizontal, Vertical, and Ratio Analysis From Schedule C (AS REPORTED) 2013 % 2014 % 2015 REVISED ed om Estimated Ending Inventory 2015 %
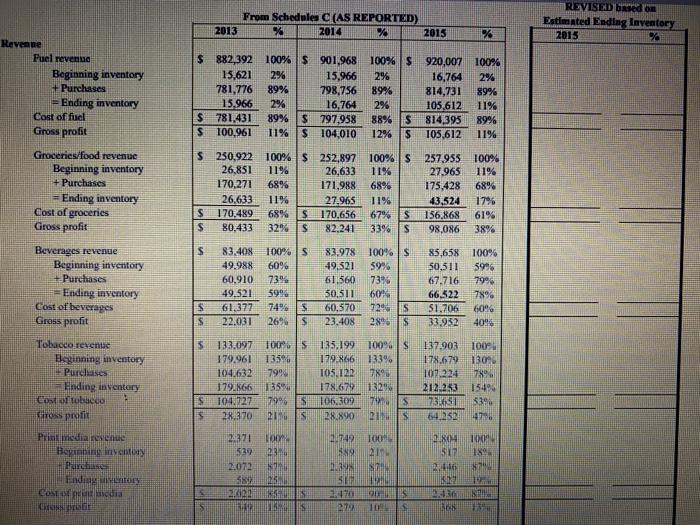
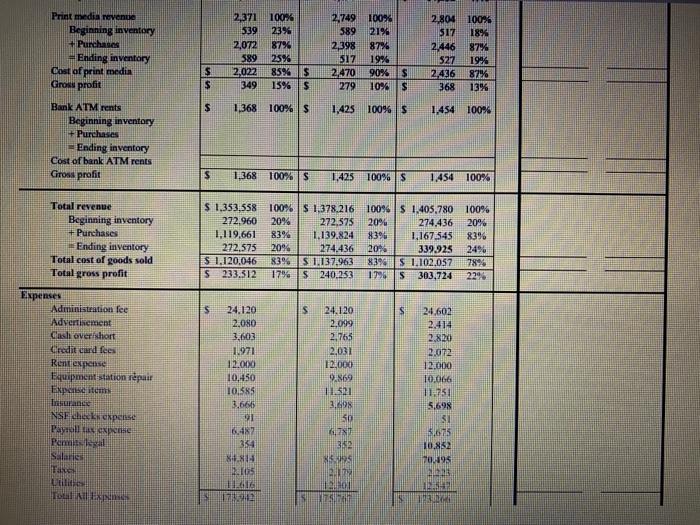
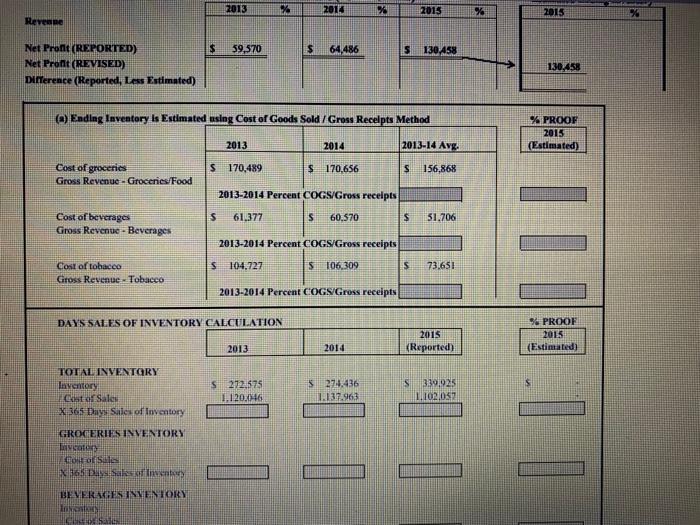
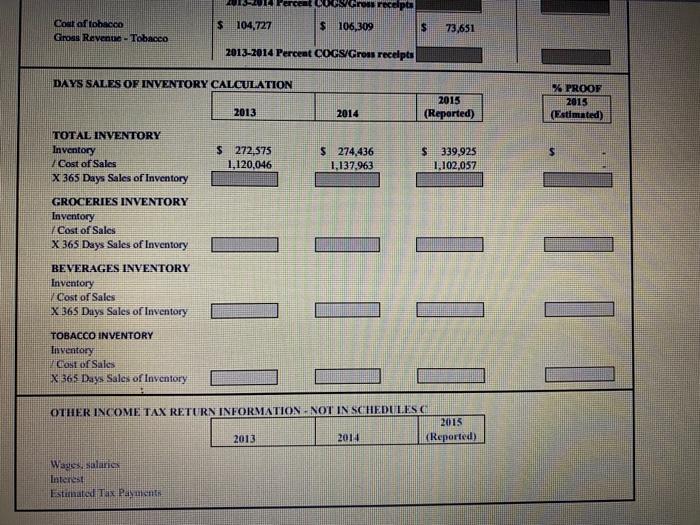
From Schedule C (AS REPORTED) 2013 % 2014 % 2015 REVISED ed om Estimated Ending Inventory 2015 % 2% Ravenne Fuel revenue Beginning inventory + Purchases = Ending inventory Cost of fuel Gross profit $ 882,392 100% S901.968 100% S 920,007 100% 15,621 2% 15.966 16,764 2% 781,776 89% 798,756 89% 814,731 89% 15.966 2% 16,764 296 105,612 11% $781.431 89%S 797,958 88% $814,395 89% S 100.961 11% $ 104,010 12% S 105,612 11% $ 250,922 100% S 252,897 100%S 257.955 100% 26,851 11% 26,633 11% 27.965 11% 170,271 68% 171,988 68% 175.428 68% 26,633 27.965 1196 43.524 s 170.489 68% S 170.656 67% $ 156,868 61% $ 80.433 32% S 82.241 33% s 98,086 38% Groceries food revenue Beginning inventory + Purchases = Ending inventory Cost of groceries Gross profit 1795 S Beverages revenue Beginning inventory + Purchases Ending inventory Cost of beverages Gross profit 83.408 49.988 60,910 49.521 61.377 22.031 100%S 6096 7342 599 7496 S 269S 83.978 49,521 61.560 50,511 60,570 23.408 100%S 59% 73% 60 324 289. 85,658 50,511 67.716 66,522 51.706 33.952 100% 5996 796 78% 6096 4015 S 100% 133% 789 Tobacco revenue Beginning inventory Purchases Ending inventory Cotobacco Cross proti 13.3.097 179.961 104.632 179.86 104.727 28.370 100 135.199 135 179.866 7999 105.12 135 178.677 7996 S 10.309 S 28.890 137.903 178.679 107224 2121253 7 45 100% 1300 789 15496 $39 S 7S INS 072 LO 2. 100 2194 NO TOO 18 Pedia Hann ch Endi Leia 52 39 529 2.072 58 2 1 27 30 . INS 5 10 S Print media revente Beginning inventory + Purchase Ending inventory Cost of print media Grow profit 2,371 100% 539 23% 2.072 87% 589 25% 2.022 85%$ 349 15%| 2.749100% 589 21% 2,398 87% SI7 19% 2,470 90% 279 10% $ 2.804 100% 517 18% 2.446 87% 527 19% 2.436 87% 368 13% $ $ $ 1.368 100% 1.425 100% S 1.454 100% Bank ATM rents Beginning inventory + Purchases - Ending inventory Cost of bank ATM rents Gross profit $ 1.368 100%S 1.425 100% S 1.454 100% $ 1,353,558 272.960 1,119,661 272,575 $ 1.120.046 S 233.512 100% S 1.378.216 10090 $ 1.405,780 100% 209 272,575 20% 274,436 20% 83% 1.139.824 8394 1.167.545 8396 2094 274.436 20% 339.925 24% 83%S 1.137.963 839 S 1.102.057 78% 179 240.253 1996 IS 303,724 229 S S S Total revenue Beginning inventory + Purchases Ending inventory Total cost of goods sold Total gross profit Expenses Administration fee Advertisement Cashi overshort credit card fees Rentexpense Equipment station repair Expose items laura NSE checks expense Payroll Pental Salaries Ta 24.120 2,080 3.603 1.971 12.000 10.450 105 3.666 91 42 334 24.120 2.099 2.763 2,031 12,000 9.869 11.5 3.698 50 77 32 5.95 BM 24,602 2.410 2,820 2.072 12.000 10.066 17751 5.698 31 05 10.852 195 2.05 111 TOLENS STA IS 2013 2013 % 2015 % 2015 24 Revene 59,570 $ 64,486 5 130 458 Net Pront (REPORTED) Net Pront (REVISED) Difference (Reported. Las Estimated) 130.458 @ Ending Inventory Is Estimated using Cost of Goods Sold / Gross Recepts Method % PROOF 2015 (Estimated) 2013 2014 2013-14 Ave Cost of groceries Gross Revenue - Groceries Food S 170,489 $ 170,656 S 156,868 2013-2014 Percent COGS/Gross receipts S 61,377 s 60.570 $ 51.706 Cost of beverages Gross Revenue - Beverages 2013-2014 Percent COGS/Gross receipts s 104.727 5 106,309 s 73.651 Cost of tobacco Gross Revenue Tobacco 2013-2014 Percent COGS Gross receipts DAYS SALES OF INVENTORY CALCULATION 2015 (Reported) 3. PROOF 2015 (Estimated) 2013 2014 TOTAL INVENTORY Inventory cestor Sales 365 DhySales of Inventory S 272.575 1.120.046 27.6.236 1.137.963 S339.925 1.102.05 GROCERIES INVENTORY laycote ont of Sale 365 Dakofin BEVERSES INVENTORY no CS Oscinerecept Cost of tobacco Gross Revenue - Tobacco $ 104,727 $ 106,309 $ 73,651 2013-2014 Percent COCS/Gross receipts DAYS SALES OF INVENTORY CALCULATION % PROOF 2015 (Estimated) 2013 2015 (Reported) 2014 S TOTAL INVENTORY Inventory Cost of Sales X 365 Days Sales of Inventory $ 272,575 1,120,046 $ 274,436 1.137,963 339.925 1,102,057 GROCERIES INVENTORY Inventory Cost of Sales X 365 Days Sales of Inventory HIIT BEVERAGES INVENTORY Inventory Cost of Sales X 365 Days Sales of Inventory TOBACCO INVENTORY Inventory Cost of Sales X 365 Days Sales of Inventory OTHER INCOME TAX RETURN INFORMATION. NOT IN SCHEDULES 2015 2013 2014 (Reported) Wages, salaries Interest Estimated Tax Payment From Schedule C (AS REPORTED) 2013 % 2014 % 2015 REVISED ed om Estimated Ending Inventory 2015 % 2% Ravenne Fuel revenue Beginning inventory + Purchases = Ending inventory Cost of fuel Gross profit $ 882,392 100% S901.968 100% S 920,007 100% 15,621 2% 15.966 16,764 2% 781,776 89% 798,756 89% 814,731 89% 15.966 2% 16,764 296 105,612 11% $781.431 89%S 797,958 88% $814,395 89% S 100.961 11% $ 104,010 12% S 105,612 11% $ 250,922 100% S 252,897 100%S 257.955 100% 26,851 11% 26,633 11% 27.965 11% 170,271 68% 171,988 68% 175.428 68% 26,633 27.965 1196 43.524 s 170.489 68% S 170.656 67% $ 156,868 61% $ 80.433 32% S 82.241 33% s 98,086 38% Groceries food revenue Beginning inventory + Purchases = Ending inventory Cost of groceries Gross profit 1795 S Beverages revenue Beginning inventory + Purchases Ending inventory Cost of beverages Gross profit 83.408 49.988 60,910 49.521 61.377 22.031 100%S 6096 7342 599 7496 S 269S 83.978 49,521 61.560 50,511 60,570 23.408 100%S 59% 73% 60 324 289. 85,658 50,511 67.716 66,522 51.706 33.952 100% 5996 796 78% 6096 4015 S 100% 133% 789 Tobacco revenue Beginning inventory Purchases Ending inventory Cotobacco Cross proti 13.3.097 179.961 104.632 179.86 104.727 28.370 100 135.199 135 179.866 7999 105.12 135 178.677 7996 S 10.309 S 28.890 137.903 178.679 107224 2121253 7 45 100% 1300 789 15496 $39 S 7S INS 072 LO 2. 100 2194 NO TOO 18 Pedia Hann ch Endi Leia 52 39 529 2.072 58 2 1 27 30 . INS 5 10 S Print media revente Beginning inventory + Purchase Ending inventory Cost of print media Grow profit 2,371 100% 539 23% 2.072 87% 589 25% 2.022 85%$ 349 15%| 2.749100% 589 21% 2,398 87% SI7 19% 2,470 90% 279 10% $ 2.804 100% 517 18% 2.446 87% 527 19% 2.436 87% 368 13% $ $ $ 1.368 100% 1.425 100% S 1.454 100% Bank ATM rents Beginning inventory + Purchases - Ending inventory Cost of bank ATM rents Gross profit $ 1.368 100%S 1.425 100% S 1.454 100% $ 1,353,558 272.960 1,119,661 272,575 $ 1.120.046 S 233.512 100% S 1.378.216 10090 $ 1.405,780 100% 209 272,575 20% 274,436 20% 83% 1.139.824 8394 1.167.545 8396 2094 274.436 20% 339.925 24% 83%S 1.137.963 839 S 1.102.057 78% 179 240.253 1996 IS 303,724 229 S S S Total revenue Beginning inventory + Purchases Ending inventory Total cost of goods sold Total gross profit Expenses Administration fee Advertisement Cashi overshort credit card fees Rentexpense Equipment station repair Expose items laura NSE checks expense Payroll Pental Salaries Ta 24.120 2,080 3.603 1.971 12.000 10.450 105 3.666 91 42 334 24.120 2.099 2.763 2,031 12,000 9.869 11.5 3.698 50 77 32 5.95 BM 24,602 2.410 2,820 2.072 12.000 10.066 17751 5.698 31 05 10.852 195 2.05 111 TOLENS STA IS 2013 2013 % 2015 % 2015 24 Revene 59,570 $ 64,486 5 130 458 Net Pront (REPORTED) Net Pront (REVISED) Difference (Reported. Las Estimated) 130.458 @ Ending Inventory Is Estimated using Cost of Goods Sold / Gross Recepts Method % PROOF 2015 (Estimated) 2013 2014 2013-14 Ave Cost of groceries Gross Revenue - Groceries Food S 170,489 $ 170,656 S 156,868 2013-2014 Percent COGS/Gross receipts S 61,377 s 60.570 $ 51.706 Cost of beverages Gross Revenue - Beverages 2013-2014 Percent COGS/Gross receipts s 104.727 5 106,309 s 73.651 Cost of tobacco Gross Revenue Tobacco 2013-2014 Percent COGS Gross receipts DAYS SALES OF INVENTORY CALCULATION 2015 (Reported) 3. PROOF 2015 (Estimated) 2013 2014 TOTAL INVENTORY Inventory cestor Sales 365 DhySales of Inventory S 272.575 1.120.046 27.6.236 1.137.963 S339.925 1.102.05 GROCERIES INVENTORY laycote ont of Sale 365 Dakofin BEVERSES INVENTORY no CS Oscinerecept Cost of tobacco Gross Revenue - Tobacco $ 104,727 $ 106,309 $ 73,651 2013-2014 Percent COCS/Gross receipts DAYS SALES OF INVENTORY CALCULATION % PROOF 2015 (Estimated) 2013 2015 (Reported) 2014 S TOTAL INVENTORY Inventory Cost of Sales X 365 Days Sales of Inventory $ 272,575 1,120,046 $ 274,436 1.137,963 339.925 1,102,057 GROCERIES INVENTORY Inventory Cost of Sales X 365 Days Sales of Inventory HIIT BEVERAGES INVENTORY Inventory Cost of Sales X 365 Days Sales of Inventory TOBACCO INVENTORY Inventory Cost of Sales X 365 Days Sales of Inventory OTHER INCOME TAX RETURN INFORMATION. NOT IN SCHEDULES 2015 2013 2014 (Reported) Wages, salaries Interest Estimated Tax Payment
Step by Step Solution
There are 3 Steps involved in it

Get step-by-step solutions from verified subject matter experts