

Question: Perform a technical analysis on this stock chart: Identify where to buy, where to sell, support and resistance levels, future chart expectations, RSI, MACD indicator
Perform a technical analysis on this stock chart:
Identify where to buy, where to sell, support and resistance levels, future chart expectations, RSI, MACD indicator interpretation, pattterns of note, etc.
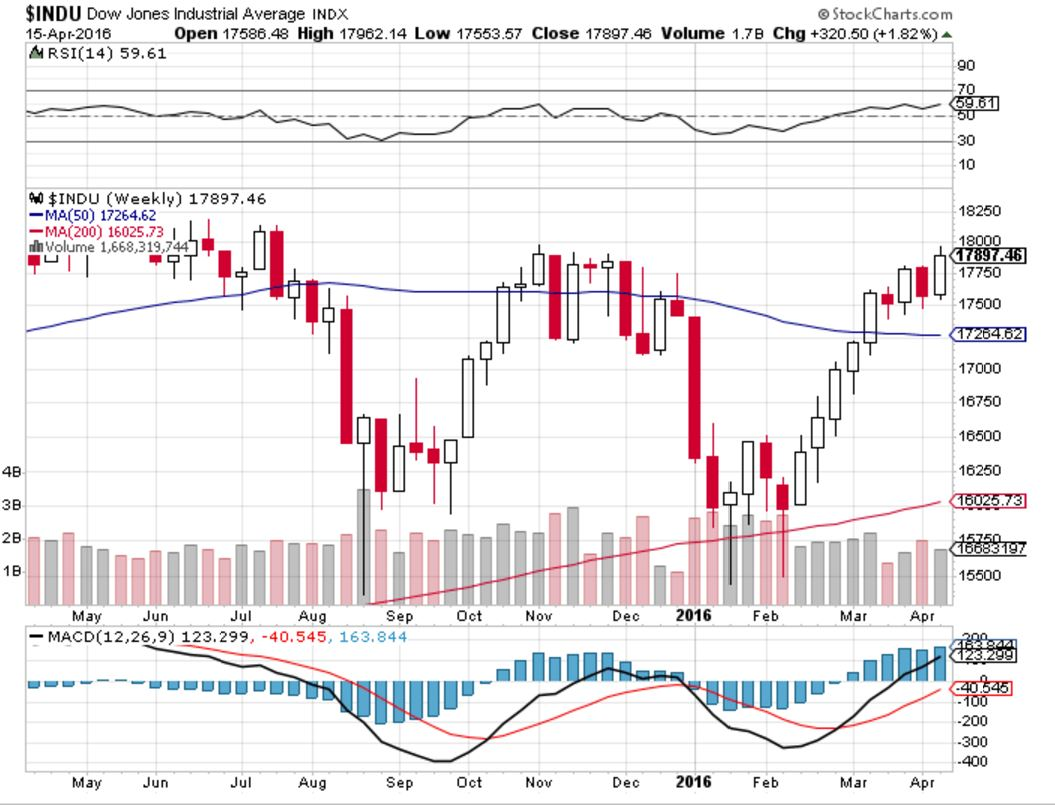
$INDU Dow Jones Industrial Average INDX 15-Apr-2016 MRSI(14) 59.61 O StockCharts.com Open 17586.48 High 1796214 Low 17553.57 Close 17897.46 Volume 17B Chg +320.50(+1.82%) 90 70 30 10 w INDU (Weekly) 17897.46 MA(50) 17264.62 18250 -MA(200) 16025.73 I n Volume 1.668,319,744 17897.45 17750 17500 17000 16750 16500 16250 4B 3B 2B 1B 15500 May Jun Jul Aug Sep Oct Now Dec 2016 Mar -MACD 12,26,9) 123.299, -40.545, 163.844 200 300 400 May Jun Jul Aug Sep Oct Nov Dec 2016 Feb Ma Apr
Step by Step Solution
There are 3 Steps involved in it

Get step-by-step solutions from verified subject matter experts