

Question: Perform a technical analysis on this stock chart: Identify where to buy, where to sell, support and resistance levels, future chart expectations, RSI, MACD indicator
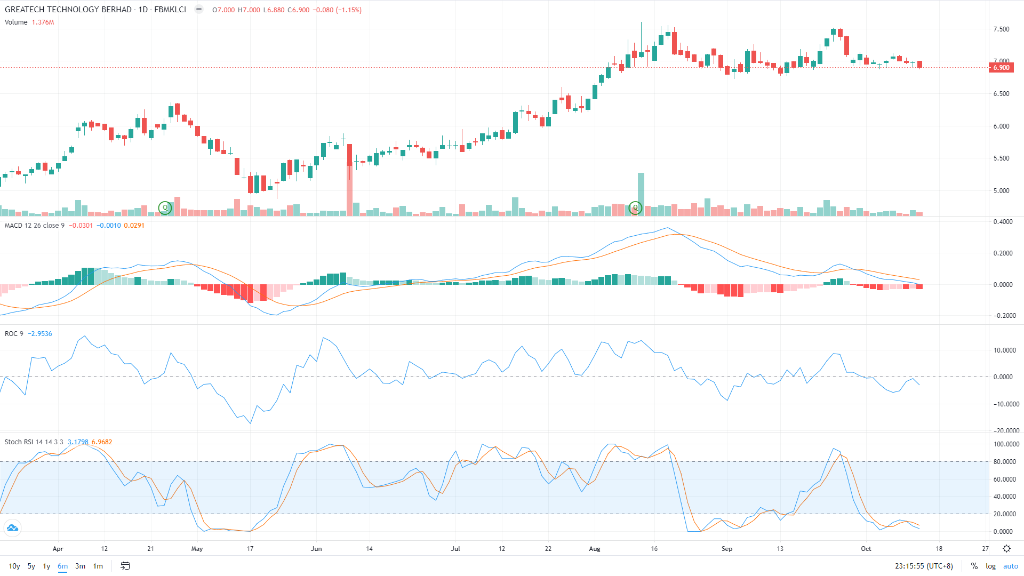 Perform a technical analysis on this stock chart: Identify where to buy, where to sell, support and resistance levels, future chart expectations, RSI, MACD indicator interpretation, pattterns of note, etc.
TECHNOLOGY BERHAD - 07.000 7.000 16.660 CA.200 -6.000 (-1,1561 8 5 1 III 23:15:55 (UTC-8)
Step by Step Solution
There are 3 Steps involved in it
1 Expert Approved Answer
Step: 1 Unlock

Question Has Been Solved by an Expert!
Get step-by-step solutions from verified subject matter experts
Step: 2 Unlock
Step: 3 Unlock