

Question: Perform ASK, MFSK, and QPSK for the given digital data using Matlab. Requirements: 1. Using the given digital data perform ASK and plot the modulated
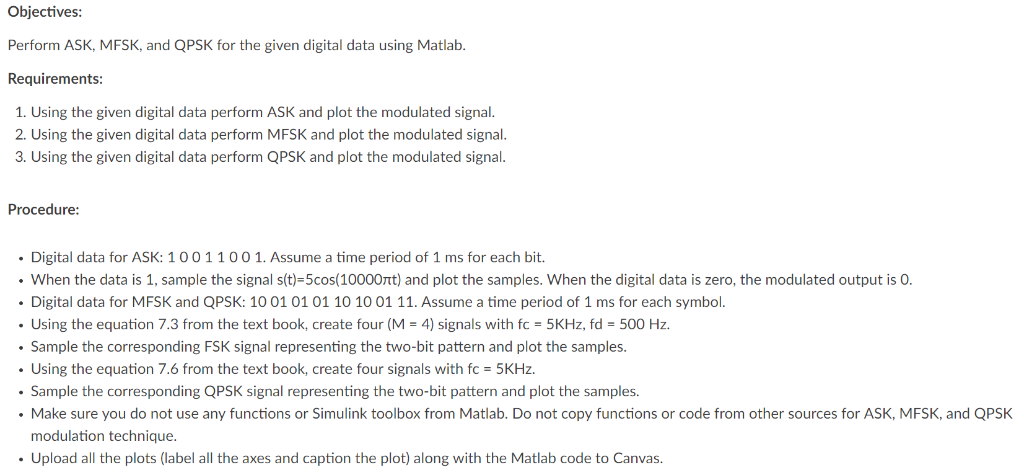
Perform ASK, MFSK, and QPSK for the given digital data using Matlab. Requirements: 1. Using the given digital data perform ASK and plot the modulated signal. 2. Using the given digital data perform MFSK and plot the modulated signal. 3. Using the given digital data perform QPSK and plot the modulated signal. Procedure: . Digital data for ASK: 100 11001. Assume a time period of 1 ms for each bit. When the data is 1, sample the signal s(t)-5cos(10000nt) and plot the samples. When the digital data is zero, the modulated output is 0 Digital data for MFSK and QPSK: 10 01 01 01 10 10 01 11. Assume a time period of 1 ms for each symbol Using the equation 7.3 from the text book, create four (M- 4) signals with fc-5KHz, fd- 500 Hz. Sample the corresponding FSK signal representing the two-bit pattern and plot the samples. Using the equation 7.6 from the text book, create four signals with fc-5KHz. Sample the corresponding QPSK signal representing the two-bit pattern and plot the samples. Make sure you do not use any functions or Simulink toolbox from Matlab. Do not copy functions or code from other sources for ASK, MFSK, and QPSK modulation technique. Upload all the plots (label all the axes and caption the plot) along with the Matlab code to Canvas Perform ASK, MFSK, and QPSK for the given digital data using Matlab. Requirements: 1. Using the given digital data perform ASK and plot the modulated signal. 2. Using the given digital data perform MFSK and plot the modulated signal. 3. Using the given digital data perform QPSK and plot the modulated signal. Procedure: . Digital data for ASK: 100 11001. Assume a time period of 1 ms for each bit. When the data is 1, sample the signal s(t)-5cos(10000nt) and plot the samples. When the digital data is zero, the modulated output is 0 Digital data for MFSK and QPSK: 10 01 01 01 10 10 01 11. Assume a time period of 1 ms for each symbol Using the equation 7.3 from the text book, create four (M- 4) signals with fc-5KHz, fd- 500 Hz. Sample the corresponding FSK signal representing the two-bit pattern and plot the samples. Using the equation 7.6 from the text book, create four signals with fc-5KHz. Sample the corresponding QPSK signal representing the two-bit pattern and plot the samples. Make sure you do not use any functions or Simulink toolbox from Matlab. Do not copy functions or code from other sources for ASK, MFSK, and QPSK modulation technique. Upload all the plots (label all the axes and caption the plot) along with the Matlab code to Canvas
Step by Step Solution
There are 3 Steps involved in it

Get step-by-step solutions from verified subject matter experts