

Question: Perform horizontal and vertical income statement analysis- comparing the P&L on Pizza Following Year Actual to the Actual P&L from the Pizza Actual to Budget
Perform horizontal and vertical income statement analysis- comparing the P&L on "Pizza Following Year Actual" to the Actual P&L from the "Pizza Actual to Budget Comparison" On the columns, call the one from class " Prior Year" and the new one "Current Year".
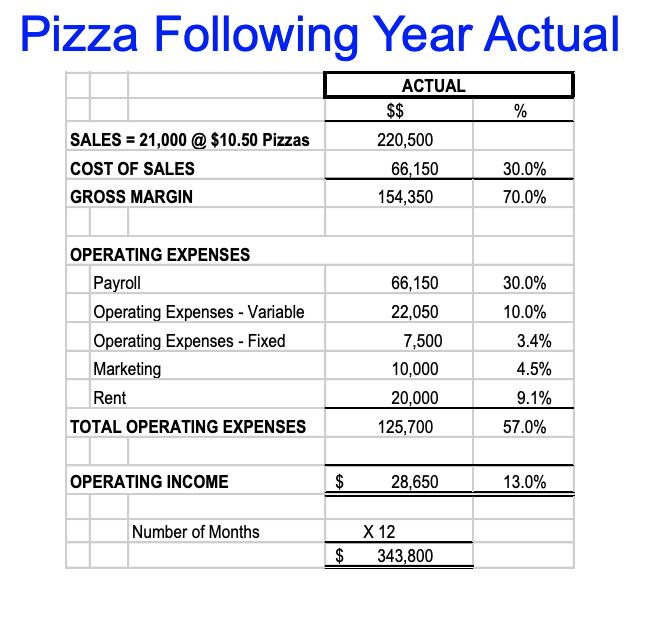
Pizza Following Year Actual ACTUAL SALES = 21,000 @ $10.50 Pizzas COST OF SALES GROSS MARGIN OPERATING EXPENSES Payroll Operating Expenses - Variable Operating Expenses - Fixed Marketing Rent TOTAL OPERATING EXPENSES OPERATING INCOME Number of Months $ $$ 220,500 66,150 154,350 66,150 22,050 7,500 10,000 20,000 125,700 28,650 X 12 $ 343,800 % 30.0% 70.0% 30.0% 10.0% 3.4% 4.5% 9.1% 57.0% 13.0%
Step by Step Solution
3.35 Rating (158 Votes )
There are 3 Steps involved in it
On the Pizza Actual to Budget Comparison spreadsheet in the Pizza Following Year Actual column ente... View full answer

Get step-by-step solutions from verified subject matter experts